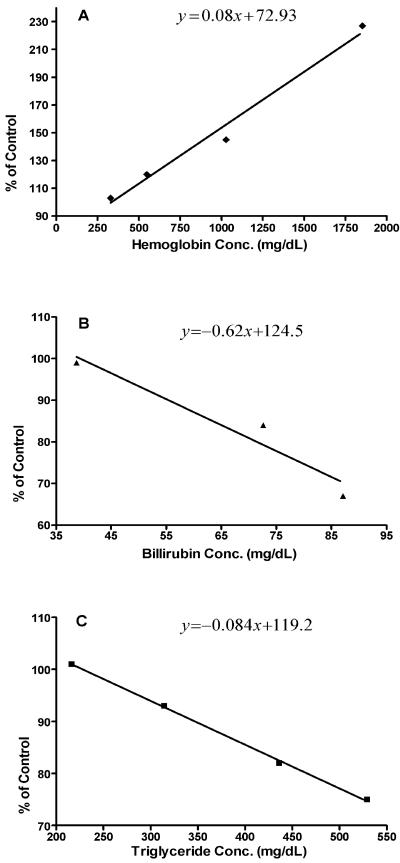
FIG. 2.
Interference plots showing the effects of increasing concentrations of hemoglobulin, bilirubin, and triglycerides on the Fungitell assay. The plots show percent inhibition of a BG-positive serum sample as a function of increasing concentrations of hemoglobin (A), bilirubin (B), and triglycerides (C).

