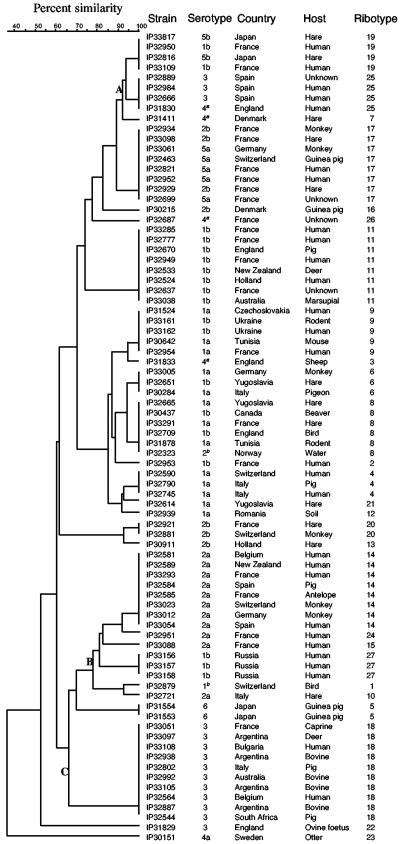
FIG. 3.
Dendrogram derived from the UPGMA clustering analysis of the Y. pseudotuberculosis ribotypes. Analysis of the combined EcoRI and EcoRV ribopatterns was done with the BioNumerics software package version 4.0 (Applied Maths, Kortrijk, Belgium). A position tolerance of 1% for EcoRI and 1.8% for EcoRV was chosen to allow 100% matching of the banding patterns obtained with duplicate samples. The Dice coefficient was used to calculate similarities. Superscripts: a, agglutination with the O:4 antiserum but genoserotype O:8; b, agglutination with the O:1 or O:2 antiserum but PCR profile corresponding to none of the 21 described genoserotypes.

