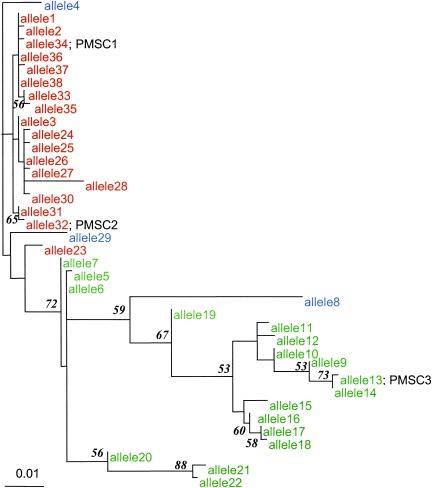
FIG. 3.
Phylogenetic tree depicting evolutionary relatedness of inlA alleles sequenced. The tree was constructed using a 706-bp 3′ fragment of inlA. Alleles representing premature stop codon mutation types 1, 2, and 3 are marked PMSC 1, 2, and 3, respectively. Genetic lineage I (as determined by EcoRI ribotyping) isolates are shown in red, lineage II isolates are shown in green, and lineage III isolates are shown in blue. inlA sequence data for lineage III isolates (n = 3), which have previously been shown to be distantly related to lineage I and II isolates (42), were used as an outgroup to root the inlA maximum likelihood tree. Bootstrap confidence measures above 50.0% for nodes in the inlA phylogram are shown at the nodes they describe. The inlA sequences used to construct this tree are available from GenBank (accession no. DQ125375 to DQ125412).

