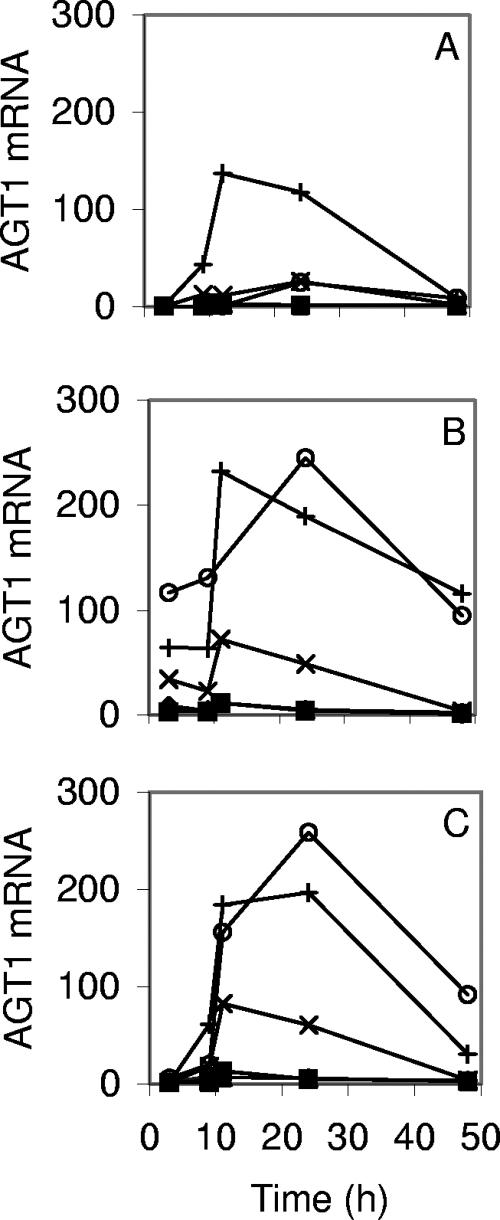
FIG. 7.
Expression of AGT1 during growths on 2% glucose (A), 2% maltose (B), and 1% glucose-1% maltose (C). The mRNA levels are expressed in the same arbitrary units in panels A, B, and C. Similar results were obtained in replicate growths on 2% maltose and 2% glucose. The strains are A15 (⧫), A24 (▪), A60 (×), A72 (▴), A179 (+), and CEN.PK2-1D (○).

