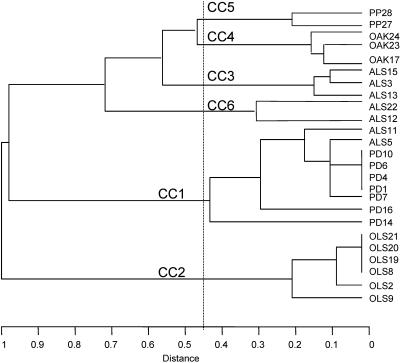
FIG. 1.
Dendrogram showing the relationships between the clonal complexes based on UPGMA from the matrix of pairwise percentage differences between the allelic profiles of the 25 isolates. The clonal complexes (CC1 to CC6) were determined with the eBURST program, and 7 out of 10 alleles was the criterion for inclusion in a complex. The dotted line indicates the region demarcating the designation of six clonal complexes.

