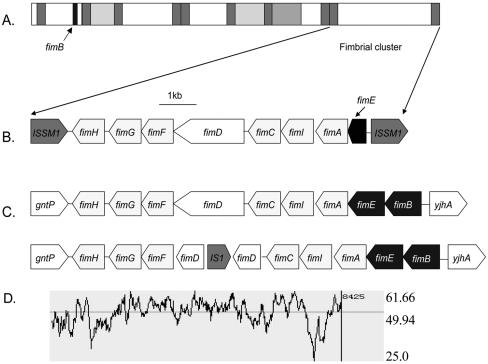
FIG. 1.
Sequence analysis of FOSU1 and its fimbrial-gene cluster. (A) Diagrammatic representation of FOSU1. Gray rectangles represent different transposases. White rectangles represent ORFs of unknown function or structural proteins. (B) Putative ORFs in the fimbrial-gene cluster identified in this study. (C) Putative ORFs in the fimbrial-gene cluster from E. coli O157:H7 EDL933 (upper) and Shigella flexneri 2a str 2457T (lower). (D) G+C content of the fimbrial cluster.

