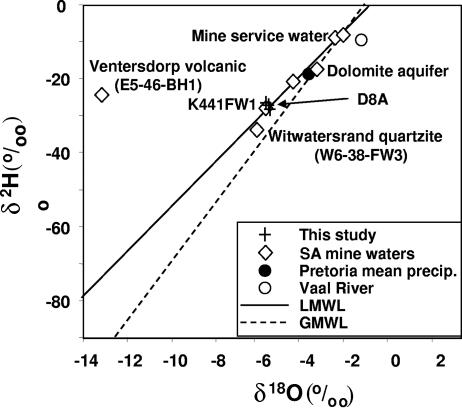
FIG. 2.
δ2H versus δ18O plot showing positions of three samples from borehole D8A (crosses) in relation to other samples from nearby mines (diamonds) (41), Vaal River water (open circle) (21), and Pretoria annual average precipitation (closed circle) (31). The local mean water line (LMWL) is depicted as a solid line (44), and the global mean water line (GMWL) is shown as a dashed line (16). The samples from D8A occupy the same positions as those from the Kloof Mine sample, for which an age of 3 to 30 Ma was determined (K4-41-FW1) (41). A sample from the Witwatersrand supergroup quartzite (W6-38-FW3) (41) also plots very close to the samples from borehole D8A, whereas samples from the overlying dolomite aquifer, mine service water (51), and a Ventersdorp supergroup metavolcanic sample (E5-46-bh1) (47) occupy different positions. The figure is based on the work of Lippmann et al. (41), with permission.

