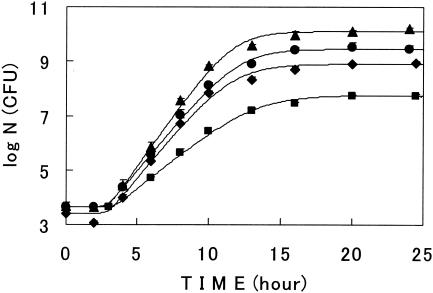
FIG. 8.
Surface growth curves of E. coli at various initial nutrition levels. Cells were grown at 30°C. Symbols: ▴, nutrient agar (the control); •, 1/5 nutrient level agar; ⧫, 1/25 nutrient level agar; ▪, agar without nutrients added. Lines describe model III. Bars show the standard deviations of the average viable cell counts.

