Abstract
A novel death-specific gene, ScDSP, was obtained from a death stage subtraction cDNA library of the diatom Skeletonema costatum. The full length of ScDSP cDNA was 921 bp in length, containing a 699-bp open reading frame encoding 232 amino acids and two stretches of 66 and 156 bp in the 5′ and 3′ untranslated regions, respectively. Analysis of the peptide structure revealed that ScDSP contained a signal peptide domain, a transmembrane domain, and a pair of EF-hand motifs. When S. costatum grew exponentially at a rate of 1.3 day−1, the ScDSP mRNA level was at 2 μmol · mole 18S rRNA−1. In contrast, when the culture entered the death phase with a growth rate decreasing to 0.5 day−1, ScDSP mRNA increased dramatically to 668 μmol · mole 18S rRNA−1, and a high degree of DNA fragmentation was simultaneously observed. Under the influence of a light-dark cycle, ScDSP expression in both exponential and stationary phases clearly showed a diel rhythm, but the daily mean mRNA level was significantly higher in the stationary phase. Our results suggest that ScDSP may play a role in the molecular mechanism of self-destructive autolysis in phytoplankton under stress.
Events of mass cell loss usually occur after algal blooms. In addition to physical damage, such as sedimentation or herbivore grazing, the self-destructive lysis of stressed cells is also considered to be a main cause for the decline of phytoplankton blooms (6, 12). Brussaard et al. (6) first used esterase activity to demonstrate that the self-destructive lysis of cells was the major loss factor accounting for 75% of the decline of a Phaeocystis bloom. Dissolved organic material released by lysed phytoplankton is subsequently utilized by heterotrophic bacteria and enters the microbial loop to support regenerated production in marine ecosystems (1, 3, 6). Such massive autolysis of phytoplanktonic cells is usually triggered by external stress factors such as nutrient starvation (4), light limitation (4, 39), and pathogenic virus infection (15). Nevertheless, the molecular regulatory mechanisms involved in cell lysis have seldom been investigated in algal cells.
Several genes are known to have a close association with self-destructive lysis in unicellular organisms. When the budding yeast Saccharomyces cerevisiae enters the stationary phase, a series of genes, including doa4, ctt1, ppn1, sod1, sod2, and so on, are expressed to maintain intracellular homeostasis, and a deficiency in any of these gene functions can cause the loss of viability (14, 16). Additionally, apoptosis-like death has also been observed in aging yeast cells. The cause of this event is considered to be facilitated by a novel metacaspase encoded by yca1 (19, 30). In phytoplankton, increasing numbers of studies have pointed out that light limitation, nutrient starvation, or the accumulation of reactive oxygen species can induce an apoptosis-like syndrome, such as cell shrinkage, blebbing, chromatin condensation, and the formation of nuclear DNA fragmentation. Through biochemical and immunological assays, these morphological characteristics of apoptosis-like cell death have been suggested to be driven by a set of caspase-like proteases (4, 39). Furthermore, self-destructive lysis triggered by a group of unknown cellular death-related executors is considered to be a possible factor in the process of bloom decline (23, 41).
The absence of knowledge about death-specific genes renders it difficult to elucidate the mechanism of self-destructive lysis in phytoplankton. In this report, gene expression profiles between the exponential and death phases in a diatom, Skeletonema costatum, were compared using the subtraction hybridization technique and a quantitative reverse transcription-PCR assay (Q-RT-PCR). A novel gene, ScDSP, encoding a calcium-regulated protein was obtained from the death-phase-specific subtraction cDNA library, and mRNA abundance in various growth phases was confirmed. Our study not only provides a new way to study the regulatory mechanisms of cell death but also offers a possibility of using ScDSP as a molecular indicator to monitor the growth situation of eukaryotic phytoplankton in marine environmental research.
MATERIALS AND METHODS
Culture conditions.
A unialgal culture of Skeletonema costatum strain Kao was grown in sterilized f/2-enriched seawater medium at 20°C under continuous illumination with irradiance at 145 μE m−2 s−1 (17, 21). Additionally, to avoid contamination by bacteria, penicillin and streptomycin (Invitrogen) were added to the medium at final concentrations of 100 U ml−1 and 100 μg ml−1, respectively. The cell concentration and morphology were monitored by placing 1 ml of algal culture into a Sedgwick-Rafter counting chamber (Hausser Scientific Partnership), and the cells were examined with a light microscope (BX60; Olympus) at a magnification of ×100 (18). Estimation of population growth rates, μ (day−1), was based on the standard equation for exponential growth: μt + 1 = (1/day)ln(Nt + 1/Nt), where Nt and Nt + 1 are the cell concentrations (cells per milliliter) at day t and t + 1 after inoculation (18). Cells harvested from day 3 (rapid growth [RG] stage) and day 8 (death stage [DS]) were used in the genomic DNA integrity assay and for suppression subtractive hybridization.
In subsequent experiments concerning mRNA expression, S. costatum was raised in the same growth conditions. However, three-quarters of the volume of the RG stage culture was removed daily and replaced by fresh f/2 medium to maintain exponential growth. On day 3 after inoculation, the daily addition of fresh medium was stopped, and the population growth rate was allowed to gradually decrease. During the culture period, cells with various growth rates were sampled for further analysis.
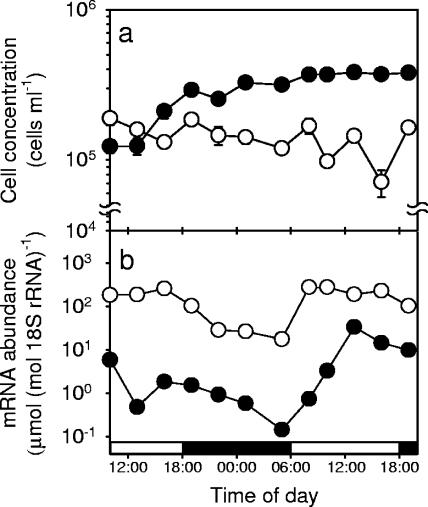
For the assay of ScDSP diel expression, two cultures were raised under the influence of a light-dark cycle of 12 h of light and 12 h of darkness. One culture was sampled for 33 h during its exponential phase, with sampling intervals of 3 h, and the other was sampled similarly during its late stationary phase. Sampling volumes were adjusted to ensure that different samples contained equal amounts of cells.
Total RNA extraction.
Approximately 107 cells were collected by filtration using a 2-μm-pore-size polycarbonate membrane (Nuclepore), followed by resuspending the cell pellet in 0.7 ml guanidine isothiocyanate-containing buffer (RLT buffer; QIAGEN) containing 1% β-mercaptoethanol. After disrupting the cells by sonication (Sonicator ultrasonic processor XL; Heat Systems-Ultrasonics, Inc.) on ice, total RNA was isolated using the silica membrane spin column included in the RNeasy Plant Mini kit (QIAGEN) according to the manufacturer's instructions. The isolated crude RNA was treated with DNase I (RNase free; Roche) at 37°C for 1 h to remove genomic DNA and was subsequently purified by acidic phenol (pH 4.0)-chloroform-isoamyl alcohol (25:24:1) extraction. The RNA concentration was determined by spectrophotometry (U-2000; Hitachi) at wavelengths of 260 and 280 nm.
Suppression subtractive hybridization.
The suppression subtractive hybridization technique was applied to enrich the genes specifically expressed in the DS culture (9, 13). The poly(A)+ RNA of both the RG and DS cultures was isolated from total RNA by a PolyATract mRNA isolation system (Promega). Two sets of the double-stranded cDNA fragments were generated and mutually subtracted using a PCR-selected cDNA subtraction kit (Clontech). Briefly, each set of double-stranded cDNA was digested with RsaI. Next, the RsaI-digested DS cDNA was diluted, divided into two parts, and ligated separately to either adaptor 1 or adaptor 2R. Subtractive hybridization was conducted by adding an excess amount of RG cDNA to adaptor 1-ligated DS cDNA, and the same procedure was repeated for the adaptor 2R-ligated DS cDNA. Subsequently, a second hybridization was performed by mixing the contents of the two reaction mixtures together with the addition of additional denatured RG cDNA. In this way, the cDNA fragments specific to the DS culture formed double-stranded cDNA with adaptor 1 on one end and adaptor 2R on the other. Finally, the DS-specific cDNA fragments were amplified by two rounds of PCR with the nested primer pairs embedded in adaptor 1 and adaptor 2R. The PCR products were then ligated into the pGEM-T vector (Promega) to generate the subtracted DS cDNA library for further screening. Similarly, RG-specific cDNA was generated by ligating adaptor 1 and adaptor 2R to cDNA from the RG culture in the process of subtractive hybridization.
All individual colonies of the subtracted DS cDNA library were blotted onto two identical nylon membranes (Perkin-Elmer). After prehybridization, one membrane was hybridized with the digoxigenin (DIG)-labeled RG-specific probe at 42°C overnight, and the other membrane was hybridized with the DIG-labeled DS-specific probe. The RG stage- and DS-specific probes were generated by PCR using the subtractive hybridization products as templates and amplified by the nested primer pair embedded in adaptor 1 and adaptor 2R. Subsequent washing was carried out in 2× SSC (1× SSC is 0.15 M NaCl plus 0.015 M sodium citrate)-0.1% sodium dodecyl sulfate (SDS) and 0.1× SSC-0.1% SDS at 60°C. Finally, CDP-Star (Tropix) was used for chemiluminescent detection.
Northern blot analysis.
A quantity of 40 μg denatured total RNA isolated from different growth stages was fractionated on a 0.7% agarose gel containing 1.2 M formaldehyde and transferred onto a nylon membrane (Perkin-Elmer) by the downward alkaline capillary transfer method described previously by Chomczynski (8). Next, the membrane was prehybridized and hybridized with the gene-specific DIG-labeled antisense riboprobe at 65°C overnight. Subsequent washing was carried out with 2× SSC-0.1% SDS and 0.5× SSC-0.1% SDS at 65°C, and chemiluminescent detection was performed using CDP-Star (Tropix).
The plasmid DNA containing the ScDSP region fragment was linearized by appropriate restriction enzyme digestion (NcoI) and served as the template for antisense riboprobe synthesis with SP6 RNA polymerase (Roche) and DIG-11-UTP containing the nucleoside triphosphate mixture (Roche).
DNA and amino acid sequence analysis.
DNA sequence analysis was performed using an ABI Prism 377A DNA sequencer with the PRISM Ready Reaction BigDye Terminator cycle sequencing kit (Applied Biosystems). The nucleic acid and deduced amino acid sequences were analyzed using Lasergene software (DNASTAR). Both BLASTX and BLASTP algorithms from the National Center for Biotechnology Information website (http://www.ncbi.nlm.nih.gov) were used for sequence analysis. The position of the putative poly(A)+ signal sequence was predicted using HCpolyA (http://www.itb.cnr.it/sun/webgene) (32). Furthermore, the structures of deduced peptides were predicted using TopPred II (http://bioweb.Pasteur.fr/seqanal/interfaces/toppred.html) (11, 24, 42), Pfam (http://www.sanger.ac.uk/cgi-bin/Pfam), and PSORT II (http://psort.ims.u-tokyo.ac.jp) (20).
Generation of full-length cDNA of ScDSP.
The total RNA isolated from the transitional stage between the RG stage and the DS was used to extract poly(A)+ RNA by a PolyATract mRNA isolation system (Promega). Poly(A)+ RNA at 2 μg was then applied to generate double-stranded cDNA fragments using the Universal RiboClone cDNA synthesis system (Promega). The primer used in the reverse transcription reaction was an oligo(dT)-NotI primer (5′-GCGAG CGGCC GCGAC CACGC GTATC GATGT CGACT TTTTT TTTTTTTTTT V-3′), where GCG GCC GC (in italics) is a NotI site and V represents A, G, or C. After fragments shorter than 500 bp were removed by a Sephacryl S-400 column (Promega), the cDNA fragments were ligated with the adaptor LL-Sal (LL-SalA, 5′-GTCAT CTATG TCGGG TGGTC GACAA GAGGT AATCC-3′; LL-SalB, 5′-pGGATT ACCTC TTGTC GACCA CCCGA CATAG AT-3′). The cDNA pool was amplified by PCR using a reaction mixture containing 3 mM MgCl2, 200 μM deoxynucleoside triphosphate, 2.5 units of the long-range, high-fidelity LA Taq polymerase (TaKaRa), and 400 nM of the Sal anchor primer (5′-GTGGT CGACA AGAGG TAATC C-3′), which was embedded in the two LL-Sal adaptors (35). The PCR conditions were set as follows: 94°C for 30 s for 1 cycle; 94°C for 30 s, 55°C for 30 s, and 68°C for 10 min for 35 cycles; and then 68°C for 30 min for 1 cycle. Finally, the LL-Sal adaptor ligated at the 3′ end of the cDNA fragments was removed by NotI treatment.
The ScDSP fragment obtained from suppression subtractive hybridization was used to design specific primers so that the full-length cDNA could be amplified from the above-mentioned cDNA pool. The 5′-end unknown sequence of ScDSP was obtained by performing PCR screening on the cDNA pool using the primer Ske-DS#2-F (5′-CAAAC GCTGC CCATA AAGAA GG-3′) and the Sal anchor. Similarly, the 3′-end unknown sequence was obtained using the Ske-DS#2-R (5′-CGGAA GTGCC CACAA AGGAT TTG-3′) and oligo(dT) anchor (5′-GACCA CGCGT ATCGA TGTCG AC-3′) primers. After confirmation by Southern hybridization using the DIG-labeled ScDSP-specific probe, the PCR product was purified from an agarose gel using a Gene-Spin DNA extraction kit (Protech) and ligated into the pGEM-T vector (Promega). DNA sequencing and analysis were then performed as described above.
Real-time Q-RT-PCR.
DNase I-treated total RNA (1 μg) was reverse transcribed into the first-strand cDNA using random hexamers (Promega) and ImpromII reverse transcriptase (Promega) at 25°C for 10 min and 48°C for 1 h. Quantitative PCRs were initiated by adding the cDNA fragments into 1× SYBR green PCR master mix (Applied Biosystems) containing 300 nM of the forward and reverse primers specifically designed for ScDSP. The reactions were then conducted in a GeneAmp 5700 sequence detection system (Applied Biosystems). PCR conditions were set to 95°C for 10 min for 1 cycle, 95°C for 15 s, and 60°C for 1 min for 40 cycles. The nucleotide sequence of primer pairs used in the Q-RT-PCR consisted of DS#2-SG-F (5′-GAACA AGCAA ACTGC ACTCG TC-3′) and DS#2-SG-R (5′-GTCAA GAATG TTGGT CGTCG CG-3′) for ScDSP. In addition, Ske-18S-F (5′-GAATT CCTAG ATATC GCAGT TCATC-3′)and Ske-18S-R (5′-GCTAA TCCAC AATCT CGACT CCTC-3′) were used for 18S rRNA. The fluorescence intensity from the SYBR green/double-stranded PCR product complex was continuously monitored from cycles 1 to 40. The cycle threshold (CT) at which the fluorescence intensity exceeded a preset threshold was used to calculate the target gene mRNA and 18S rRNA expression levels.
To properly present the gene expression data, the comparative CT method and the standard curve method were combined to calculate an RNA molar ratio between a target gene (X) and a reference gene (R). In our case, ScDSP mRNA and 18S rRNA were used as X and R, respectively. According to Livak and Schmittgen (28), as PCRs reach their specific threshold cycle numbers,
 |
(1) |
where XT and RT are the numbers of target and reference molecules at their corresponding CTs, X0 and R0 are the initial numbers of target and reference molecules, EX and ER are amplification efficiencies of X and R, and CT,X and CT,R are the cycle threshold numbers of X and R, respectively. If the same threshold SYBR green fluorescence intensity is used for X and R, the target reaction tube at CT,X should have the same amount (weight) of PCR product as does the reference tube at CT,R, which can be expressed as follows:
 |
(2) |
where MR and MX are the molecular weights of the target and reference amplicons, respectively. As for the estimation of amplification efficiencies, EX and ER, standard curves are generated by creating a dilution series of the target and reference genes, and a linear relationship exists between CT and the logarithm of the initial concentration. The slope, b, of the standard curve thus represents the number of additional PCR cycles required to reach the threshold fluorescence intensity when the initial concentration is reduced by 10-fold. Since the amplification efficiency, E, is defined as the fraction of increase after a single PCR cycle, the relationship between E and b becomes as follows:
 |
(3) |
Substituting equations 2 and 3 back into equation 1 followed by the logarithmic transformation generates the following equation:
 |
(4) |
where bX and bR are the standard curve slopes of X and R, respectively. The specificity of the Q-RT-PCR was confirmed by performing a melting temperature analysis with the GeneAmp 5700 sequence detection system (Applied Biosystems) as the temperature rises from 65 to 95°C within 20 min and was also examined by electrophoresis on a 3% agarose gel containing 0.5× Tris-boric acid-EDTA buffer.
Genomic DNA extraction.
Genomic DNA was obtained from S. costatum byextracting algal cells in lysis buffer (0.1 M EDTA [pH 8.0], 1 mM Tris-Cl [pH8.0], 0.25% SDS, and 0.1 mg ml−1 proteinase K) overnight at 55°C with gentle shaking. Subsequently, cell debris and residual polysaccharide were removed by adding 1% hexadecyltrimethylammonium bromide (Sigma) followed by chloroform extraction and centrifugation. An additional round of phenol-chloroform-isoamyl alcohol (25:24:1) extraction was conducted to elicit the protein contaminants (10). Finally, the genomic DNA pellet precipitated by isopropanol was resuspended in Tris-EDTA buffer (pH 7.5), and its concentration was determined by spectrophotometry (U-2000; Hitachi) at wavelengths of 260 and 280nm.
Genomic DNA integrity assay.
Genomic DNA fragmentation was detected using the in situ terminal transferase-mediated dUTP nick end-labeling (TUNEL) technique. Cells were fixed with 4% (wt/vol) paraformaldehyde in phosphate-saline buffer (pH 7.5) at 4°C overnight and stored in methanol at −20°C before the labeling reaction was performed. About 107 fixed cells were adherent onto a polylysine-coated slide by centrifugation at 500 × g for 10 min. After sequential rehydration through a series of 75%, 50%, and 25% (vol/vol) ethanol and phosphate-saline buffer (pH 7.5), cells were permeabilized with 0.1% (vol/vol) Triton X-100 in 0.1% (wt/vol) sodium citrate at room temperature for 30 min. Next, an in situ TUNEL reaction was performed in the labeling solution containing terminal deoxynucleotidyl transferase (TdT) and fluorescein-12-dUTP (with an in situ cell death detection kit; Roche). Slides were washed with phosphate-saline buffer (pH 7.5) several times and were then examined with an epifluorescent microscope (with excitation at 450 to 490 nm and emission at ≥515 nm) (Axioplan 2; Zeiss). The positive-control sample was treated with DNase I (10 units ml−1) (Roche) at 37°C for 15 min prior to the labeling reaction. For the negative-control sample, TdT was omitted from the labeling solution. The occurrence of genomic DNA fragmentation was also confirmed by electrophoresis on a 2% agarose gel containing 0.5× Tris-boric acid-EDTA buffer.
Nucleotide sequence accession number.
The nucleotide sequence of ScDSP has been deposited in the GenBank database under accession number AY962391.
RESULTS
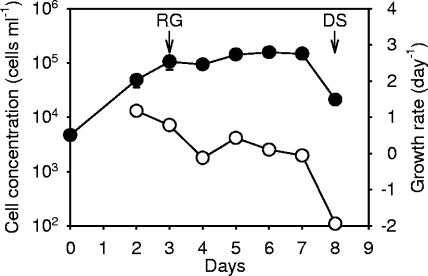
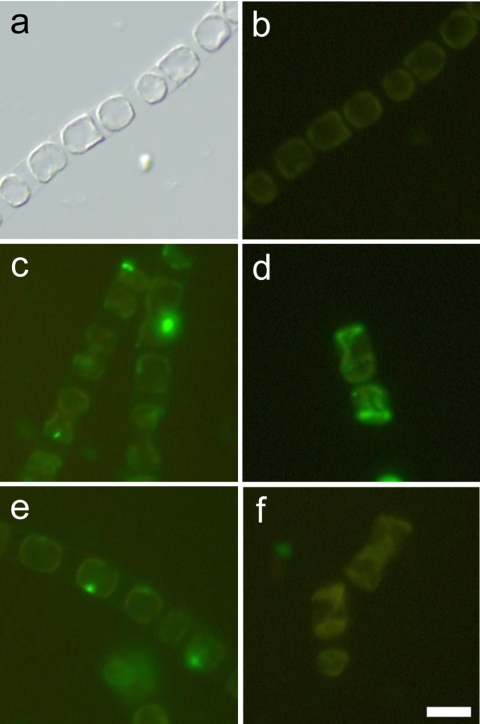
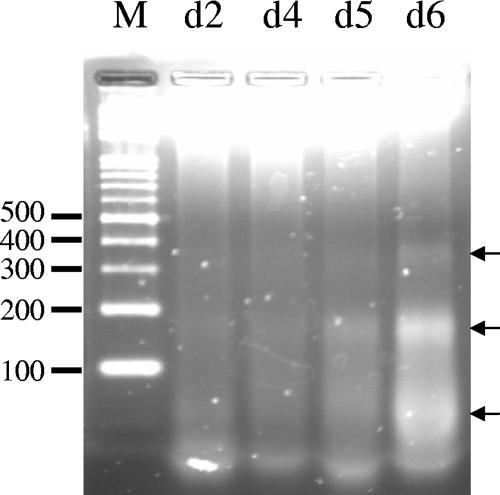
After cells were inoculated in f/2 medium in the presence of antibiotics, the growth of Skeletonema costatum followed a classical logistic growth curve with the cell concentration increasing from 4.8 × 10⁴ cells ml−1 on day 2 to 1.5 × 10⁵ cells ml−1 on day 7 (Fig. 1). The culture without antibiotics behaved similarly (data not shown). The population growth rate was at the highest level of 1.2 day−1 on day 2 (at the RG stage). In the RG stage, cells formed long chains with about 20 to 30 cells in each chain, and no dead cells were observed (Fig. 2a, b, and e). Subsequently, the population growth rate steadily declined to 0 day−1 between days 2 and 7. On day 8 (at the DS), the cell number decreased dramatically from 1.5 × 10⁶ cells ml−1 to 2.1 × 10⁴ cells ml−1. Along with aging of the culture, cell chains became shorter, and large amounts of dead empty cells were found in the culture (Fig. 2c, d, and f). An in situ TUNEL analysis was conducted to determine the presence of nuclear DNA fragmentation which occurred in different growth stages of S. costatum. In the exponential growth stage, no positive signals were observed, apparently a result of the absence of DNA free ends that allow the incorporation of fluorescein-labeled dUTP (Fig. 2b). In contrast, when cells entered the late stationary phase, the green fluorescence began to appear in the nucleus (Fig. 2c). After another 24 h had passed, most cells were empty and possessed no green fluorescence. For cells which still retained some cytoplasmic material, the green fluorescence signal had spread to the entire cell, obviously a result of nuclear disintegration (Fig. 2d). As a positive control, when the DNA free ends were created by DNase I, cells in the exponential phase were readily labeled with green fluorescence (Fig. 2e). Furthermore, genomic DNA fragmentation was also confirmed by DNA electrophoresis. When the population entered the stationary phase (day 6), small DNA fragments ranging from 200 to 400 bp in size were clearly seen after 2% agarose gel electrophoresis (Fig. 3).
FIG. 1.
Time course of cell numbers (solid circles) and growth rate (open circles) of the Skeletonema costatum culture used for the construction of the subtracted cDNA libraries. Arrows indicate the time points in the RG and death stages at which samples were collected for total RNA extraction. Error bars indicate standard errors (SE) of the mean cell number (n = 3). Data points without an error bar indicate that the error bar was smaller than the symbol. Growth rates were calculated from the mean cell number and plotted without error bars.
FIG. 2.
Skeletonema costatum cell morphology and nuclear DNA fragmentation as revealed by an in situ TUNEL assay in various growth phases. (a, b) Exponential phase; (c) late stationary phase; (d) death phase; (e) exponential-phase cells treated with DNase I before TUNEL staining (positive control); (f) late-stationary-phase cells with the TdT enzyme omitted from the TUNEL staining buffer (negative control). Panel a is the bright-field image of a differential interference contrast microscope. A scale bar of 10 μm is shown in panel f.
FIG. 3.
Skeletonema costatum DNA fragmentation assay on representative days during the culture period. Equal amounts of nuclear DNA extracted from the culture on days 2 (d2), 4 (d4), 5 (d5), and 6 (d6) after inoculation were separated by 2% agarose gel electrophoresis to assay the occurrence of nuclear DNA fragmentation. Arrows on the right indicate the positions of small DNA fragments. Lane M contains the molecular weight standard of DNA with increments of 100 bp.
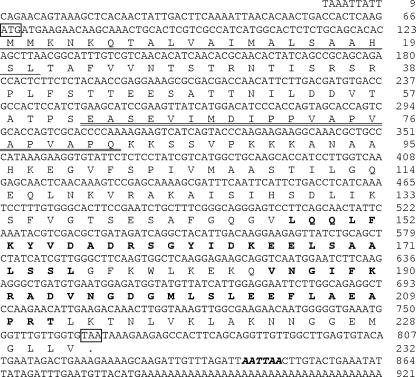
After the DS-related gene fragments were enriched by suppression subtraction hybridization, 58 death-related cDNA fragments were obtained. With the completion of nucleotide sequence analysis, we discovered that 16 of the 58 death-related fragments shared the same nucleotide sequence, implying that the expression of this gene was greatly enhanced in aged S. costatum. For this reason, one of the 16 identical fragments, DS#2, was chosen for further analysis. The mRNA level of DS#2 in the DS was 430-fold higher than that in the RG stage. Based on the known sequence of DS#2, the full-length DS#2 cDNA of 921 bp in length was obtained from a transitional-stage cDNA library using a modified method for rapid amplification of cDNA ends (Fig. 4). Furthermore, the DNA sequence in the coding region was confirmed by reverse transcription-PCR amplification using high-fidelity DNA polymerase (Advantage cDNA polymerase mixture; Clontech) with primers located at the amino acid positions 1 to 8 and 225 to 232. The full-length DS#2 contained a 699-bp open reading frame encoding 232 amino acids and two stretches of 66 and 156 bp in length for the 5′ and the 3′ untranslated regions, respectively. In the 3′ untranslated region, a putative poly(A)+ signal sequence (AATTAA) was found at −38 bp upstream of the poly(A)+ tail. A signal peptide domain was located at amino acid positions 1 to 21. Based on a TopPredII prediction, the region at amino acid positions 62 to 82 was a transmembrane domain due to its hydrophobic property. Additionally, a pair of EF-hand motifs for calcium ion binding was identified at the amino acid positions 148 to 175 and 185 to 212, respectively (Fig. 4). According to the mRNA expression levels, the protein secondary structure, and motif analysis, DS#2 cDNA should encode a novel calcium-regulated and membrane-associated protein in S. costatum and was named ScDSP (death-specific protein in S. costatum).
FIG. 4.
Nucleotide and deduced amino acid sequences of ScDSP from Skeletonema costatum. The start and stop codons are indicated by boxes. The poly(A)+ signal located upstream of the poly(A)+ tail is shown in italics. The signal peptide domain is underlined, and the putative transmembrane domain is marked by double underlining. Two putative calcium-binding motifs (the EF-hand domains) are shown in boldface type. The size of this full-length sequence matches that revealed by the Northern blot analysis (Fig. 7). Numbers on the right indicate the nucleotide and amino acid positions. The GenBank accession number is AY962391.
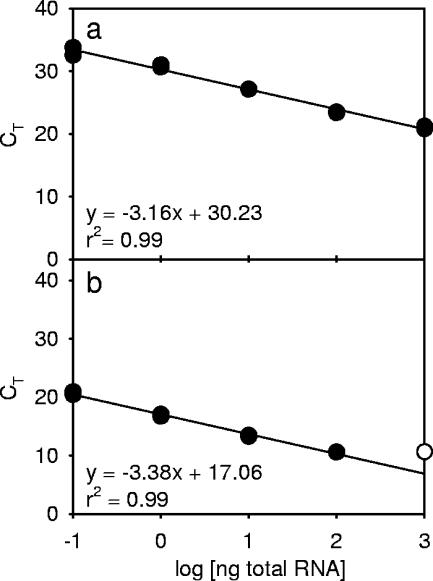
In the Q-RT-PCR analysis, standard curves were generated to calibrate the PCR efficiency for ScDSP and 18S rRNA. The threshold cycles (CT) of these two genes were linearly correlated to the logarithms of quantities of total RNA in the serially diluted standard solution (r2 = 0.99; P < 0.01). Slopes of the standard curves were −3.16 for ScDSP and −3.38 for 18S rRNA, respectively, and both were close to the theoretical value of −3.32 (Fig. 5). However, the difference between the slopes was too large to use the ΔΔCT method, and therefore, equation 4 was used to express the Q-RT-PCR results.
FIG. 5.
Q-RT-PCR standard curves of (a) ScDSP and (b) 18S rRNA. Curves were generated by plotting the logarithm of various total RNA concentrations (10−1 to 103 ng) versus their CT values. The open circle in b means that the reaction was saturated, which was caused by a high concentration of RNA, and was not used in the linear regression analysis.
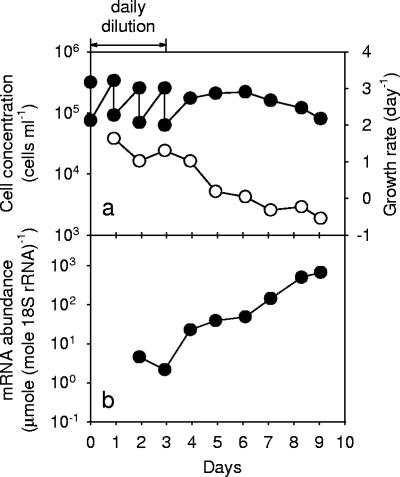
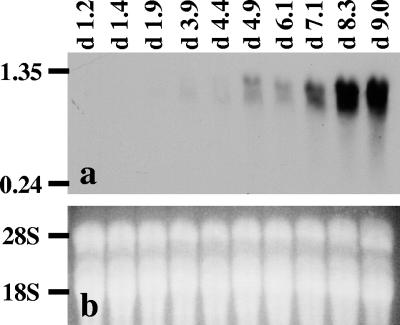
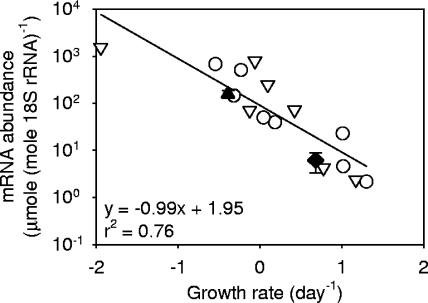
Daily dilution was an effective method for maintaining the culture of S. costatum at the exponential phase with high growth rates ranging from 1.0 to 1.6 day−1. Cells readily grew back to a high level of 3.4 × 10⁵ cells ml−1 within 24 h of the dilution. When the daily replenishment of fresh medium was terminated on day 3, the culture gradually entered the stationary phase with declining growth rates (Fig. 6a). In this culture, the ScDSP mRNA levels quantified by Q-RT-PCR stayed at a low level of between 2.1 to 4.5 μmol · mole 18S rRNA−1 when cells grew exponentially (Fig. 6b). After day 3, the ScDSP mRNA level dramatically increased with the culture's age. On day 9, a decrease in the cell concentration was observed, and the ScDSP mRNA level reached the highest level at 668 μmol · mole 18S rRNA−1 (Fig. 6b). This pattern of ScDSP expression was further confirmed by Northern blot analysis. On the Northern blot, a single band appeared near the 1.35-kb marker on day 4.9 (Fig. 7). The signal densities showed an obvious increase starting from day 4.9, and the pattern of increase coincided with the trend detected by the Q-RT-PCR analysis. The time course of ScDSP expression was repeated with a separate algal culture, and the same trend was observed. On a logarithmic scale, the ScDSP mRNA concentrations in two independent time course experiments showed a highly significant linear relationship with population growth rates (r2 = 0.76; P < 0.01) (Fig. 8). As expected, the slope of the regression line was negative.
FIG. 6.
Time courses for (a) cell numbers (solid circles), growth rates (open circles), and (b) ScDSP mRNA levels in the culture of Skeletonema costatum. Cultures were diluted daily using fresh f/2 medium between days 1 and 3 after inoculation. In panel a, all error bars with a size of ±1 SE are smaller than the symbols (n = 3). Growth rates were obtained from the mean cell numbers and are plotted without the error bars.
FIG. 7.
Northern blot analysis of the time course of ScDSP mRNA levels in Skeletonema costatum. (a) Total RNA samples were fractionated on a 0.7% formaldehyde-agarose gel and transferred to a nylon membrane. ScDSP mRNA was detected with the gene-specific DIG-labeled antisense riboprobe. The time points (in days) of sampling are indicated at the top. The numbers (in kilobases) on the left side are the positions of the RNA standards. The smear of ScDSP mRNA was caused by loading too much total RNA into the sample wells. (b) Total RNA integrity was examined by ethidium bromide staining after agarose electrophoresis. The positions of 18S and 28S rRNA are indicated on the left.
FIG. 8.
Correlation between ScDSP mRNA levels and Skeletonema costatum population growth rates. Data from two independent time course experiments were combined in the linear regression analysis (n = 15; P < 0.01). Open circles indicate the data points of the first time course experiment shown in Fig. 6, and open triangles are data points from an independent replicate experiment. The solid diamond and triangle indicate the daily mean mRNA levels of ScDSP obtained from the diel rhythm experiments in the exponential and late stationary phases, respectively. Error bars indicate ±1 SE (n = 12). Data points without an error bar mean that the error bar is smaller than the symbol.
Diel variations in ScDSP mRNA expression levels in the exponential and late stationary growth phases were investigated by growing S. costatum under a light-dark cycle of 12 h of light and 12 h of darkness. During the 33-h sampling period, cell numbers in the exponentially growing culture increased from 1.2 × 10⁵ to 3.6 × 10⁵ cells ml−1 with a growth rate of 0.68 day−1. In contrast, cell numbers in the late-stationary-phase culture decreased from 1.9 × 10⁵ to 1.0 × 10⁵ cells ml−1 with a negative growth rate of −0.39 day−1 (Fig. 9a). A similar diel variation in the ScDSP mRNA expression level was observed in both the exponential-phase and late-stationary-phase cultures. After the onset of the light period, ScDSP mRNA levels instantly increased and reached a maximum at the midpoint of the light period. This high expression level was maintained until the end of the light period. After that, the ScDSP mRNA abundance gradually decreased in the dark period. At the end of the dark period, the ScDSP mRNA level reached its daily lowest value of 0.15 μmole · mole 18S rRNA−1 in the exponential phase or 17.53 μmole · mole 18S rRNA−1 in the late stationary phase. Regardless of whether the cell population was in the exponential or late stationary phase, ScDSP mRNA levels in the light period were always 10- to 100-fold higher than those in the dark period (Fig. 9b). However, although a diel oscillation was always present, the ScDSP gene was still more actively expressed in the late stationary phase. For example, the maximum ScDSP mRNA abundance was 33.5 μmole · mole 18S rRNA−1 in the exponential phase, but it reached 190 μmole · mole 18S rRNA−1 at the same time point in the late stationary phase (Fig. 9b). On average, the 33-h mean mRNA abundance was 6.1 μmole · mole 18S rRNA−1 in the exponential phase but was 156.7 μmole · mole 18S rRNA−1 in the late stationary phase, an increase of about 30-fold (Fig. 8 and 9). Interestingly, when the exponentially growing cells entered the second light-dark cycle during the sampling period, ScDSP mRNA reached a level of 33.5 μmole · mole 18S rRNA−1, much higher than the maximum in the first light-dark cycle (Fig. 9b).
FIG. 9.
Diel variations of (a) Skeletonema costatum cell numbers and (b) ScDSP mRNA levels determined separately in the exponential (solid circles) and late stationary (open circles) phases under a light-dark cycle of 12 h of light and 12 h of darkness. In panel a, error bars indicate ±1 SE (n = 3), and data points without an error bar mean that the error bar is smaller than the symbol.
DISCUSSION
In the real-time Q-RT-PCR, the 2−ΔΔCT method is a simple way to describe the relative changes among target gene mRNA levels under different physiological treatments (28, 38, 43). However, this method requires that the amplification efficiencies of the target and reference genes are approximately equal. In our study, although the standard curve slopes of ScDSP (−3.16) and 18S rRNA (−3.38) were close to the theoretical value of −3.32, a statistical comparison indicated that the amplification efficiencies of the ScDSP and 18S rRNA primer pairs were not close enough to satisfy the assumption of the 2−ΔΔCT method (28). Moreover, the use of an arbitrary calibrator sometimes makes it difficult to compare results from different batches of an experiment. In order to resolve these problems, an equation modified from the 2−ΔΔCT method was developed to calculate the absolute ratio of the target to the reference RNA (equation 4). This modified algorithm does not require extra experimental work compared to the 2−ΔΔCT method but includes the molecular weight of the amplicons and standard curve slopes in its computation. Our results indicated that the basal expression levels of ScDSP mRNA in exponentially growing S. costatum cells were between 1 and 10 μmole · mole 18S rRNA−1, which is close to mRNA levels of a constitutive gene, GAPDH, in humans (40). In addition, Northern hybridization analysis confirmed the pattern generated by Q-RT-PCR, indicating that the absolute ratio method is a reliable algorithm (Fig. 6b and 7). In the absolute ratio method, a stable expression level of the reference gene is necessary for an accurate evaluation of the expression of a target gene. Although 18S rRNA is generally accepted as a good biomass standard, its expression pattern on a per-cell basis in S. costatum must be examined. Based on the standard curves, an absolute quantification revealed that the cellular levels of 18S rRNA decreased from 1.2 × 10³ fmol · 106 cells−1 on day 2 to 0.6 × 10³ fmol · 106 cells−1 on day 8 (9). Since the variation was less than twofold, 18S rRNA is definitely a good reference gene for the quantification of ScDSP expression by our absolute ratio method.
Although ScDSP is a newly discovered gene with no homologue in the GenBank database, it should be a widespread gene in the Bacillariophyceae. In a recently decoded genome of a diatom, Thalassiosira pseudonana (2), we found a deduced peptide that was translated from the nucleotide sequence at the positions of 132 to 804 bp in scaffold 334, and it showed a high homogeneity (56.7% identity and 65.4% similarity) with ScDSP. According to the peptide structure prediction results, ScDSP encoded a membrane-bound protein that contained a pair of EF-hand domains to sense changes in intracellular calcium concentrations caused by environmental stimuli. Calcium is a ubiquitous messenger associated with calcium-regulated proteins that elicits numerous intercellular responses (5, 37). All of the calcium-regulated proteins typically contain EF-hand motifs and an effector domain. When calcium ions bind to EF-hand motifs, the conformation of the peptide changes, which leads to the activation or inactivation of the effector domain and initiation of the signal transduction cascade (29, 31). In metazoans, it is well established that disruption of intracellular calcium homeostasis can cause cytotoxicity, and this induces a set of calcium-regulated proteins to trigger either apoptotic or necrotic death (22, 33, 34, 36). To our knowledge, ScDSP is the first calcium-regulated and growth-related protein identified in eukaryotic phytoplankton. The expression pattern of ScDSP was negatively correlated to the growth rate (Fig. 8), which implies its involvement in an apoptosis-like process in S. costatum. Further support of this deduction comes from the occurrence of nuclear DNA fragmentation in aged algal cultures (Fig. 2 and 3).
In multicellular organisms, cells undergoing apoptosis display a characteristic pattern of morphological changes including blebbing of the cell membrane and nuclear disintegration. The collapse of the nucleus is associated with the activation of a calcium-dependent endonuclease, which cleaves the nuclear DNA into oligonucleosome length DNA fragments (34). Therefore, the occurrence of nuclear DNA fragmentation indicates that the self-destruction mechanism in dying S. costatum cells is similar to the apoptosis-like pathway in metazoans (7, 39, 41). In agreement with this view, Vardi et al. (41) pointed out that oxidative stress promoted nuclear DNA fragmentation in the dinoflagellate Peridinium gatunense and terminated its bloom in Lake Kinneret, Israel. Furthermore, in the Northern Adriatic Sea, TUNEL-labeled cells were observed to increase with the concentration of S. costatum during a bloom event (7).
Of course, an elevated expression level associated with a decreasing growth rate is not enough to ensure the involvement of ScDSP in an apoptosis-like pathway. Algal cells under stress often activate their compensation and acquisition systems by raising the expression of related genes. For example, La Roche et al. (25) found several proteins that were actively expressed in nitrogen-, phosphorus-, or iron-limited media, and one of these proteins, flavodoxin, has been applied as an indicator to monitor iron deprivation in the marine environment (26). In Tetraselmis chui, a high-affinity phosphate transporter encoded by TcPHO was obtained from an early-stationary-phase-subtracted cDNA library and showed a high expression level under phosphorus-limited conditions when the growth was slow (9). Although the possession of calcium-binding motifs makes ScDSP fit the apoptosis scenario well, more-extensive studies are needed to provide a direct link.
With the enhanced expression in the stationary and death phases, ScDSP has the potential to become a superior indicator of physiological state in the ocean. Several molecular markers, such as rbcL (ribulose-1,5-bisphosphate carboxylase/oxygenase) and PCNA (proliferating cell nuclear antigen), have already been applied to evaluate the growth potential of eukaryotic phytoplankton in the field (27, 44). A common feature of these genes is that they are all more actively expressed when phytoplankton cells are rapidly growing. In this case, ScDSP complements these “exponential markers” by indicating whether a phytoplankton population is going to experience massive cell death soon. Another advantage of using ScDSP is that its mRNA level in the late stationary phase is about 300-fold higher than that in the exponential phase (Fig. 8), which simplifies data interpretation. Diel variations of ScDSP expression inevitably introduce inconvenience for field application (Fig. 9). However, the amplitudes of diel rhythms were less than the difference between the exponential and stationary phases. Meaningful results can still be obtained by conducting a 24-h sampling.
Acknowledgments
We thank C. C. Lin and D. N. Lin for their help with DNA sequencing.
This study was supported by research grants NSC 91-2313-B-019-012 and 92-2313-B-019-050 issued by the National Science Council (Republic of China). C.-C.C. was supported by National Science Council postdoctoral fellowship grants NSC 93-2811-M-019-001 and 93-2611-M-019-004.
REFERENCES
- 1.Agustí, S., M. P. Satta, M. P. Mura, and E. Benavent. 1998. Dissolved esterase activity as a tracer of phytoplankton lysis rates in the northwestern Mediterranean. Limnol. Oceanogr. 43:1836-1849. [Google Scholar]
- 2.Armbrust, E. V., J. A. Berges, C. Bowler, B. R. Green, D. Martinez, N. H. Putnam, S. Zhou, A. E. Allen, K. E. Apt, M. Bechner, M. A. Brzezinski, B. K. Chaal, A. Chiovitti, A. K. Davis, M. S. Demarest, J. C. Detter, T. Glavina, D. Goodstein, M. Z. Hadi, U. Hellsten, M. Hildebrand, B. D. Jenkins, J. Jurka, V. V. Kapitonov, N. Kröger, W. W. Y. Lau, T. W. Lane, F. W. Larimer, J. C. Lippmeier, S. Lucas, M. Medina, A. Montsant, M. Obornik, M. S. Parker, B. Palenik, G. J. Pazour, P. M. Richardson, T. A. Rynearson, M. A. Saito, D. C. Schwartz, K. Thamatrakoln, K. Valentin, A. Vardi, F. P. Wilkerson, and D. S. Rokhsar. 2004. The genome of the diatom, Thalassiosira pseudonana: ecology, evolution, and metabolism. Science 306:79-86. [DOI] [PubMed] [Google Scholar]
- 3.Azam, F., T. Fenchel, J. G. Field, J. S. Gray, L. A. Meyer-Reil, and F. Thingstad. 1983. The ecological role of water-column microbes in the sea. Mar. Ecol. Prog. Ser. 10:257-263. [Google Scholar]
- 4.Berges, J. A., and P. G. Falkowski. 1998. Physiological stress and cell death in marine phytoplankton: induction of proteases in response to nitrogen or light limitation. Limnol. Oceanogr. 43:129-135. [Google Scholar]
- 5.Berridge, M. J., P. Lipp, and M. D. Bootman. 2000. The versatility and universality of calcium signalling. Nat. Rev. Mol. Cell Biol. 1:11-21. [DOI] [PubMed] [Google Scholar]
- 6.Brussaard, C. P. D., R. Riegman, A. A. M. Noordeloos, G. C. Cadée, H. Witte, A. J. Kop, G. Nieuwland, F. C. van Duyl, and R. P. M. Bak. 1995. Effects of grazing, sedimentation and phytoplankton cell lysis on the structure of a coastal pelagic food web. Mar. Ecol. Prog. Ser. 123:259-271. [Google Scholar]
- 7.Casotti, R., S. Mazza, C. Brunet, V. Vantrepotte, A. Ianora, and A. Miralto. 2005. Growth inhibition and toxicity of the diatom aldehyde 2-trans, 4-trans-decadienal on Thalassiosira weissflogii (Bacillariophyceae). J. Phycol. 41: 7-20. [Google Scholar]
- 8.Chomczynski, P. 1992. One-hour downward alkaline capillary transfer for blotting of DNA and RNA. Anal. Biochem. 201:134-139. [DOI] [PubMed] [Google Scholar]
- 9.Chung, C.-C., S.-P. L. Hwang, and J. Chang. 2003. Identification of a high-affinity phosphate transporter gene in a prasinophyte alga, Tetraselmis chui, and its expression under nutrient limitation. Appl. Environ. Microbiol. 69:754-759. [DOI] [PMC free article] [PubMed] [Google Scholar]
- 10.Clark, C. G. 1992. DNA purification from polysaccharide-rich cells, p. D-3.1-2. In J. J. Lee and A. T. Soldo (ed.), Protocol in protozoology. Society of Protozoology, Lawrence, Kans.
- 11.Claros, M. G., and G. von Heijne. 1994. TopPredII: an improved software for membrane protein structure predictions. Comput. Appl. Biosci. 10:685-686. [DOI] [PubMed] [Google Scholar]
- 12.Cushing, D. H. 1992. The loss of diatoms in the spring bloom. Philos. Trans. R. Soc. Lond. B 335:237-246. [Google Scholar]
- 13.Desai, S., J. Hill, S. Trelogan, L. Diatchenko, and P. D. Siebert. 2000. Identification of differentially expressed genes by suppression subtractive hybridization, p. 81-112. In S. P. Hunt and F. J. Livesey (ed.), Functional genomics. Oxford University Press, New York, N.Y.
- 14.Fabrizio, P., and V. D. Longo. 2003. The chronological life span of Saccharomyces cerevisiae. Aging Cell 2:73-81. [DOI] [PubMed] [Google Scholar]
- 15.Fuhrman, J. A. 1999. Marine viruses and their biogeochemical and ecological effects. Nature 399:541-548. [DOI] [PubMed] [Google Scholar]
- 16.Gray, J. V., G. A. Petsko, G. C. Johnston, D. Ringe, R. A. Singer, and M. Werner-Washburne. 2004. “Sleeping beauty”: quiescence in Saccharomyces cerevisiae. Microbiol. Mol. Biol. Rev. 68:187-206. [DOI] [PMC free article] [PubMed] [Google Scholar]
- 17.Guillard, R. R. L., and J. H. Ryther. 1962. Studies on marine planktonic diatom. I. Cyclotella nana Hustedt and Detonula confervacae (Cleve). Gran. Can. J. Microbiol. 8:229-239. [DOI] [PubMed] [Google Scholar]
- 18.Guillard, R. R. L. 1973. Division rates, p. 289-311. In J. R. Stein (ed.), Handbook of phycological methods: culture methods and growth measurements. Cambridge University Press, Cambridge, United Kingdom.
- 19.Herker, E., H. Jungwirth, K. A. Lehmann, C. Maldener, K.-U. Fröhlich, S. Wissing, S. Büttner, M. Fehr, S. Sigrists, and F. Madeo. 2004. Chronological aging leads to apoptosis in yeast. J. Cell Biol. 164:501-507. [DOI] [PMC free article] [PubMed] [Google Scholar]
- 20.Horton, P., and K. Nakai. 1997. Better prediction of protein cellular localization sites with the k nearest neighbors classifier. Proc. Int. Conf. Intel. Syst. Mol. Biol. 5:147-152. [PubMed] [Google Scholar]
- 21.Hwang, S.-P. L., S.-K. Wang, S.-F. Wei, L.-C. Cheng, and J. Chang. 1999. Identification and expression pattern of DNA polymerase α gene in a marine diatom, Skeletonema costatum. Mar. Biotechnol. 1:200-206. [DOI] [PubMed] [Google Scholar]
- 22.Inbal, B., S. Bialik, I. Sabanay, G. Shani, and A. Kimchi. 2002. DAP kinase and DRP-1 mediate membrane blebbing and the formation of autophagic vesicles during programmed cell death. J. Cell Biol. 157:455-468. [DOI] [PMC free article] [PubMed] [Google Scholar]
- 23.Kirchman, D. L. 1999. Phytoplankton death in the sea. Nature 398:293-294. [Google Scholar]
- 24.Kyte, J., and R. F. Doolittle. 1982. A simple method for displaying the hydropathic character of a protein. J. Mol. Biol. 157:105-132. [DOI] [PubMed] [Google Scholar]
- 25.La Roche, J., R. J. Geider, L. M. Graziano, H. Murray, and K. Lewis. 1993. Induction of specific proteins in eukaryotic algae grown under iron-, phosphorus-, or nitrogen-deficient conditions. J. Phycol. 26:767-777. [Google Scholar]
- 26.La Roche, J., P. W. Boyd, R. M. L. Mckay, and R. J. Geider. 1996. Flavodoxin as an in situ marker for iron stress in phytoplankton. Nature 382:802-805. [Google Scholar]
- 27.Lin, S., and E. J. Carpenter. 1995. Growth characteristics of marine phytoplankton determined by cell cycle proteins: the cell cycle of Ethmodiscus rex (Bacillariophyceae) in the southwestern North Atlantic Ocean and Caribbean Sea. J. Phycol. 31:778-785. [Google Scholar]
- 28.Livak, K. J., and T. D. Schmittgen. 2001. Analysis of relative gene expression data using real-time quantitative PCR and the 2−ΔΔCT method. Methods 25:402-408. [DOI] [PubMed] [Google Scholar]
- 29.Luan, S., J. Kudla, M. Rodriguez-Concepcion, S. Yalovsky, and W. Gruissem. 2002. Calmodulins and calcineurin B-like proteins: calcium sensors for specific signal response coupling in plants. Plant Cell 14:S389-S400. [DOI] [PMC free article] [PubMed] [Google Scholar]
- 30.Madeo, F., E. Herker, C. Maldener, S. Wissing, S. Lächelt, M. Herlan, M. Fehr, K. Lauber, S. J. Sigrist, S. Wesselborg, and K.-U. Fröhlich. 2002. A caspase-related protease regulates apoptosis in yeast. Mol. Cell 9:911-917. [DOI] [PubMed] [Google Scholar]
- 31.Means, A. R., and J. R. Dedman. 1980. Calmodulin—an intracellular calcium receptor. Nature 285:73-77. [DOI] [PubMed] [Google Scholar]
- 32.Milanesi, L., M. Muselli, and P. Arrigo. 1996. Hamming clustering method for signals prediction in 5′ and 3′ regions of eukaryotic genes. Comput. Appl. Biosci. 12:399-404. [DOI] [PubMed] [Google Scholar]
- 33.Nakagawa, T., and J. Yuan. 2000. Cross-talking between two cysteine protease families: activation of caspase-12 by calpain in apoptosis. J. Cell Biol. 150:887-894. [DOI] [PMC free article] [PubMed] [Google Scholar]
- 34.Orrenius, S., B. Zhivotovsky, and P. Nicotera. 2003. Regulation of cell death: the calcium-apoptosis link. Nat. Rev. Mol. Cell Biol. 4:552-565. [DOI] [PubMed] [Google Scholar]
- 35.Piao, Y., N. T. Ko, M. K. Lim, and M. S. H. Ko. 2001. Construction of long-transcript enriched cDNA libraries from submicrogram amounts of total RNAs by a universal PCR amplification method. Genome Res. 11:1553-1558. [DOI] [PMC free article] [PubMed] [Google Scholar]
- 36.Robertson, J. D., S. Orrenius, and B. Zhivotovsky. 2000. Nuclear events in apoptosis. J. Struct. Biol. 129:346-358. [DOI] [PubMed] [Google Scholar]
- 37.Rudd, J. J., and V. E. Franklin-Tong. 2001. Unraveling response-specificity in Ca2+ signaling pathways in plant cells. New Phytol. 151:7-33. [DOI] [PubMed] [Google Scholar]
- 38.Schmittgen, T. D., B. A. Zakrajsek, A. G. Mills, V. Gorn, M. J. Singer, and M. W. Reed. 2000. Quantitative reverse transcription-polymerase chain reaction to study mRNA decay: comparison of endpoint and real-time methods. Anal. Biochem. 285:194-204. [DOI] [PubMed] [Google Scholar]
- 39.Segovia, M., L. Haramaty, J. A. Berges, and P. G. Falkowski. 2003. Cell death in the unicellular chlorophyte Dunaliella tertiolecta. A hypothesis on the evolution of apoptosis in higher plants and metazoans. Plant Physiol. 132:99-105. [DOI] [PMC free article] [PubMed] [Google Scholar]
- 40.Tricarico, C., P. Pinzani, S. Bianchi, M. Paglierani, V. Distante, M. Pazzagli, S. A. Bustin, and C. Orlando. 2002. Quantitative real-time reverse transcription polymerase chain reaction: normalization to rRNA or single housekeeping genes is inappropriate for human tissue biopsies. Anal. Biochem. 309:293-300. [DOI] [PubMed] [Google Scholar]
- 41.Vardi, A., I. B. Berman-Frank, T. Rozenberg, O. Hadas, A. Kaplan, and A. Levine. 1999. Programmed cell death of the dinoflagellate Peridinium gatunense is mediated by CO2 limitation and oxidative stress. Curr. Biol. 9:1061-1064. [DOI] [PubMed] [Google Scholar]
- 42.von Heijne, G. 1992. Membrane protein structure prediction hydrophobicity analysis and positive-inside rule. J. Mol. Biol. 225:487-494. [DOI] [PubMed] [Google Scholar]
- 43.Winer, J., C. K. S. Jung, I. Shackel, and P. M. Williams. 1999. Development and validation of real-time quantitative reverse transcriptase-polymerase chain reaction for monitoring gene expression in cardiac myocytes in vitro. Anal. Biochem. 270:41-49. [DOI] [PubMed] [Google Scholar]
- 44.Wyman, M., J. T. Davies, D. W. Crawford, and D. A. Purdie. 2000. Molecular and physiological responses of two classes of marine chromophytic phytoplankton (diatoms and prymnesiophytes) during the development of nutrient-stimulated blooms. Appl. Environ. Microbiol. 66:2349-2357. [DOI] [PMC free article] [PubMed] [Google Scholar]


