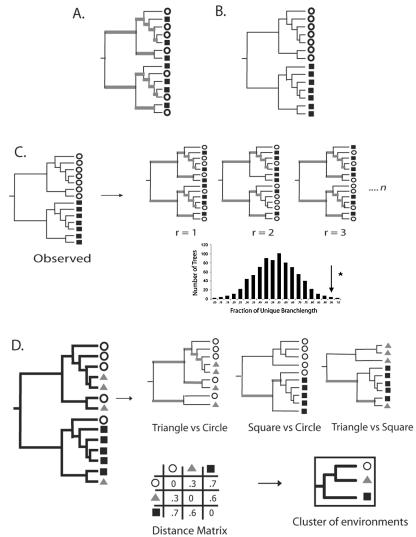
FIG. 1.
Calculation of the UniFrac distance metric. Squares, triangles, and circles denote sequences derived from different communities. Branches attached to nodes are colored black if they are unique to a particular environment and gray if they are shared. (A) Tree representing phylogenetically similar communities, where a significant fraction of the branch length in the tree is shared (gray). (B) Tree representing two communities that are maximally different so that 100% of the branch length is unique to either the circle or square environment. (C) Using the UniFrac metric to determine if the circle and square communities are significantly different. For n replicates (r), the environment assignments of the sequences were randomized, and the fraction of unique (black) branch lengths was calculated. The reported P value is the fraction of random trees that have at least as much unique branch length as the true tree (arrow). If this P value is below a defined threshold, the samples are considered to be significantly different. (D) The UniFrac metric can be calculated for all pairwise combinations of environments in a tree to make a distance matrix. This matrix can be used with standard multivariate statistical techniques such as UPGMA and principal coordinate analysis to compare the biotas in the environments.

