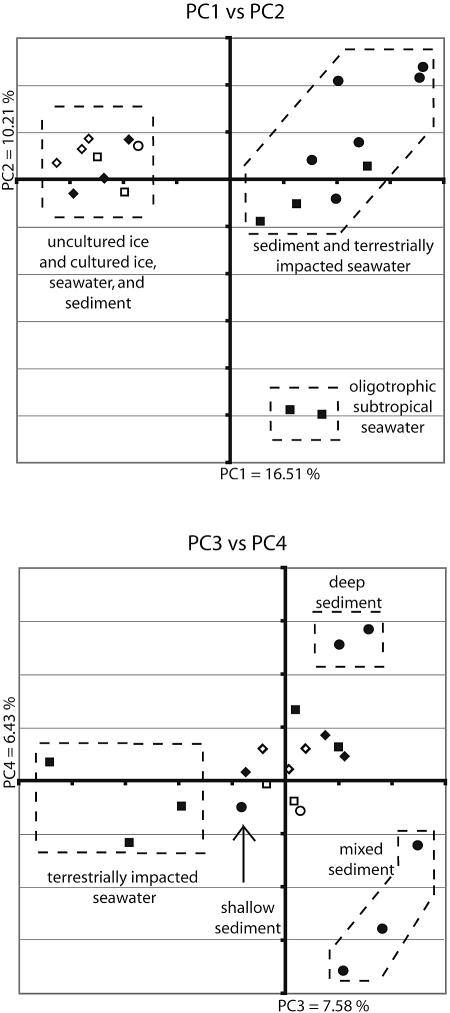
FIG. 3.
First four principal coordinates from a principal coordinate analysis of marine samples. Samples from marine ice are represented by diamonds, sediment samples are represented by circles, and water samples are represented by squares. Shapes representing samples derived from cultured isolates are open, and those representing samples from environmental clones are filled. The percentages in the axis labels represent the percentages of variation explained by the principal coordinates.

