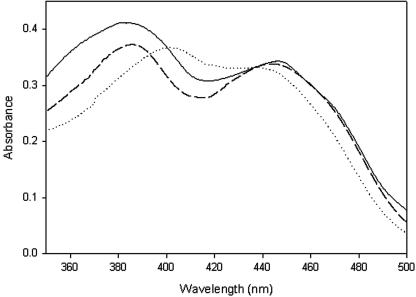
FIG. 1.
Flavin absorption spectra. The spectra of the native and wild-type recombinant enzymes and the H70Y mutant are indicated by solid, dashed, and dotted lines, respectively. The protein concentration was 2 mg/ml in 20 mM Tris-HCl (pH 8.0). The native and recombinant enzymes had similar spectra with two maxima, at 380 nm and 444 nm; the maximum wavelength was shifted from 380 nm to 400 nm in the H70 mutant.

