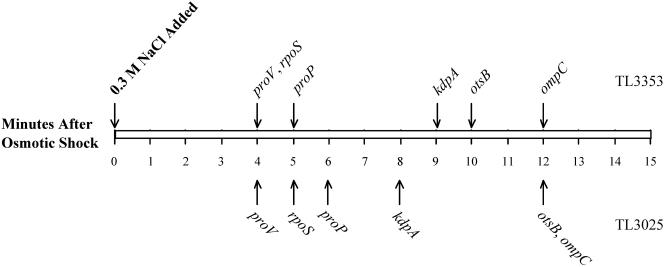
FIG. 6.
The timeline of induction of osmotically controlled genes. This figure shows the threshold induction times of the proV, kdpA, proP, rpoS, otsB, and ompC genes after shock with 0.3 M NaCl. The threshold induction times of these genes were determined by ANOVA, as described in Materials and Methods. The arrows above the rectangle show the times of induction of each gene in strain TL3353 after shock with 0.3 M NaCl, extracted from the data shown in Fig. 2 and 3, and the arrows below the rectangle show induction times obtained with strain TL3025 in a similar experiment (primary data not shown).

