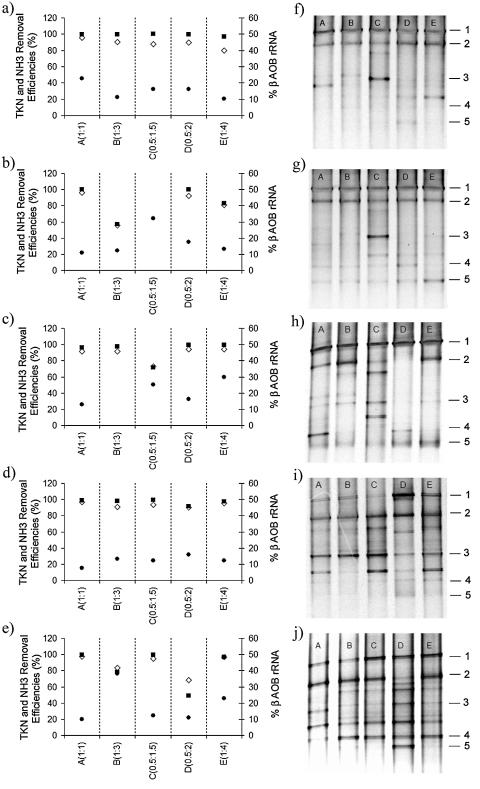
FIG. 1.
Comparison between composition of AOB populations and ammonia and TKN removal efficiencies in intermittently aerated reactors. (a to e) ⋄, TKN removal efficiency; ▪, ammonia removal efficiency; •, rRNA fraction of AOB in the Betaproteobacteria subgroup. (f to j) amoA DGGE profiles. Sequence analysis of bands 1 to 5 is discussed in the text and summarized in Table 5. Panels a and f correspond to day 78, b and g correspond to day 170, c and h correspond to day 226, d and i correspond to day 281, and e and j correspond to day 310.

