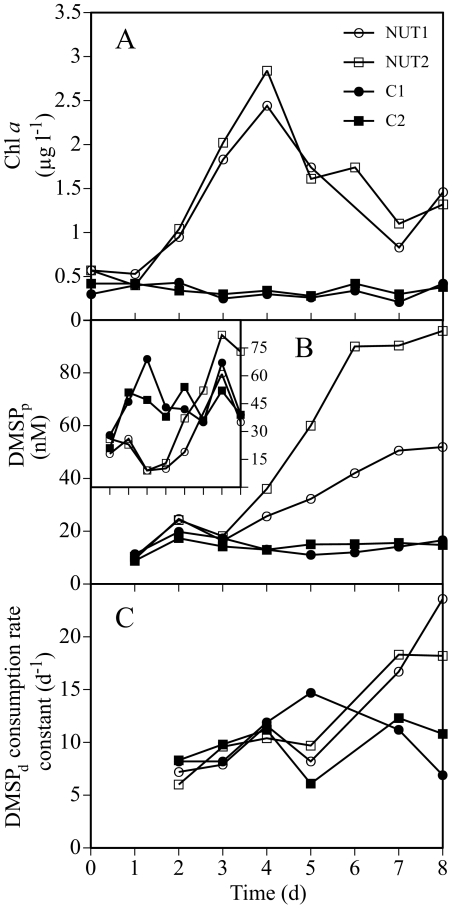
FIG. 2.
Dynamics in Chl a, DMSP concentrations, and DMSP consumption rates during the microcosm experiment. (A) Variability in Chl a concentrations; (B) concentrations of DMSPp; (C) consumption rate constants of DMSPd. Inset figure in panel B shows the daily values of the DMSPp-to-Chl a ratio, expressed as nanomoles per microgram. l, liter; d, days.

