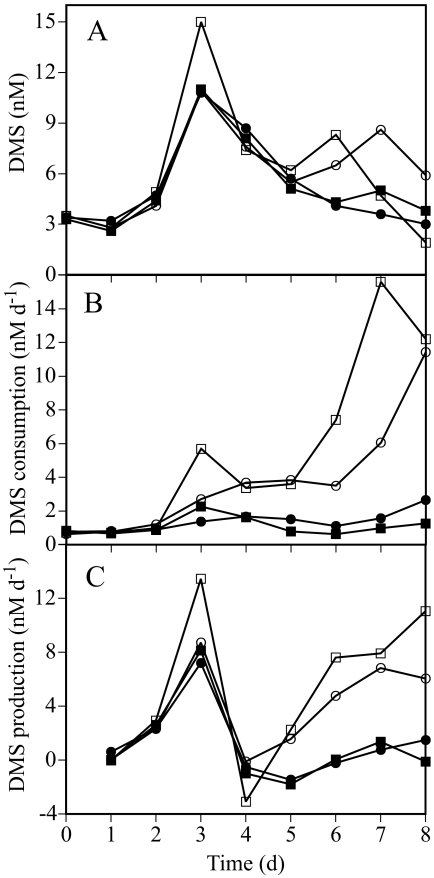
FIG. 3.
Changes in DMS concentrations and process rates during the experiment. (A) Concentrations of DMS; (B) DMS consumption; (C) DMS production rates estimated from the DMS concentrations and DMS consumption. Symbols are as shown in Fig. 2. d, days.

