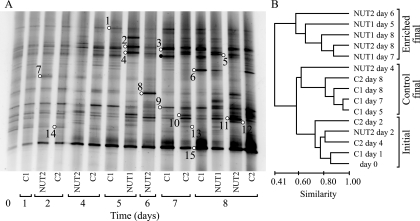
FIG. 5.
DGGE analysis of the composition of the bacterial assemblage over 8 days. (A) DGGE profiles in the enriched and control microcosms. (B) Dendrogram comparing the bacterial DGGE fingerprints of samples from the microcosm experiment. Bands marked by open circles denote phylotypes identified by sequencing; adjoined numbers refer to phylotypes with the prefix DI in Table 4. The band marked by a filled black circle could be assigned to Bacteroidetes, but poor sequence quality prevented detailed identification.

