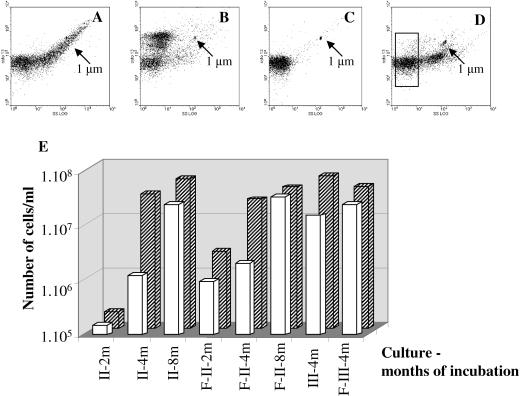
FIG. 4.
Examples of flow cytometry plots of side scatter (SS) versus green fluorescence of different enrichment populations. Cells were stained with SYTO 13. Arrows show the position of 1-μm beads. (A) Melted ice sample; (B) round II filtered R2B culture showing three clusters of small cells with different fluorescence intensities; (C) filtrate of an enrichment culture showing small cells (see white bars in panel E); (D) round II nonfiltered culture in R2B with two cell clusters with different sizes and a gate for ultrasmall cells; (E) flow cytometry results showing the number of filterable cells (white bars) that pass through a 0.2-μm filter related to the total number of cells (hatched bars) in rounds II and III of nonfiltered and filtered R2B cultures (designated F-II and F-III) after 2, 4, and 8 months.

