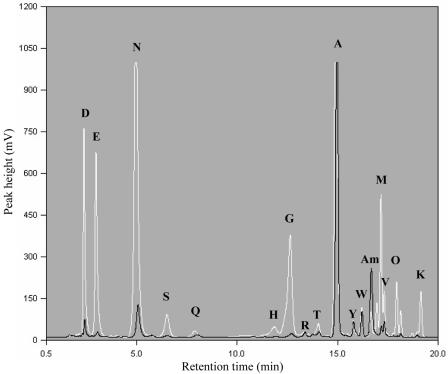
FIG. 4.
Pattern of amino acid utilization during cultivation of E. coli DH1(pMa/c5-914::cphA6803) on 6% (vol/vol) protamylasse. Samples were obtained from the 500-liter batch cultivation experiment with the recombinant strain of E. coli and centrifuged, and the supernatant was then analyzed by HPLC as described in Materials and Methods. The white line shows the chromatogram obtained from an analysis of the sample withdrawn at the beginning of the fermentation (0 h), whereas the black line represents the chromatogram of the sample withdrawn at the end of the cultivation (14 h). Each peak represents a specific amino acid or another metabolite in relation to the retention time, as indicated in the figure. The values shown on the y axis (mV) indicate the concentrations of the respective compounds. Abbreviations: A, alanine; Am, ammonium; D, aspartic acid; E, glutamic acid; G, glycine; H, histidine; K, lysine; M, methionine; N, asparagine; O, ornithine; Q, glutamine; R, arginine; S, serine; T, threonine; V, valine; W, tryptophan; Y, tyrosine.

