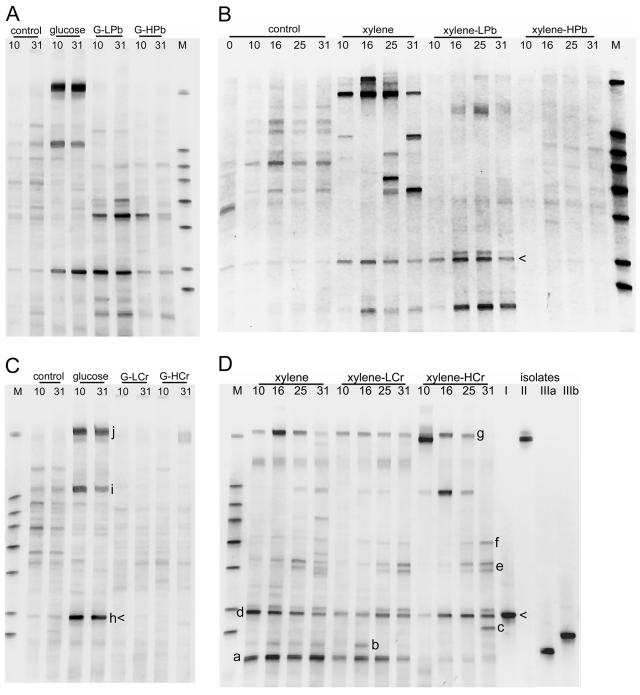
FIG. 5.
Community profiles based on DGGE profiles of the V3 region of the 16S rRNA gene amplified by PCR from DNA extracts from microcosms amended with glucose and lead (A), xylene and lead (B), glucose and chromate (C), and xylene and chromate (D). The number above each lane represents the day the microcosm was sampled. G, glucose; L, low metal; H, high metal; M, markers used to normalize band mobilities between different gels. In panel D, the lanes marked I, II, IIIa, and IIIb indicate xylene-degrading bacterial isolates for which the best 16S rRNA gene sequence matches are as follows: I, Arthrobacter sp.; II, Pseudomonas fluorescens; and IIIa and IIIb, Rhodococcus sp. Arrowheads designate bands matching isolates from group I. Letters a to h and i to k designate bands that were excised and sequenced from gels from xylene and glucose microcosms, respectively. See Table 3 for the phylogenetic identities of these bands.

