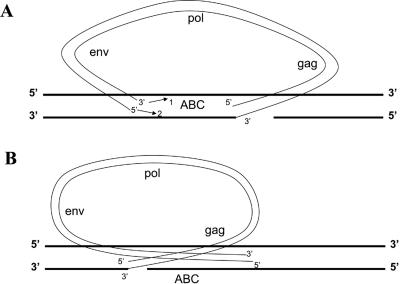
FIG. 7.
Models for the generation of duplications and deletions in host DNA flanking the aberrant proviruses. Viral DNA is indicated by thin black lines, and host DNA is shown by thick black lines. (A) Models to explain the duplication and capture of host sequence. Arrow 1 shows that only the 3′ end is joined. This will cause the provirus to be inserted and host sequence “ABC” to be duplicated flanking provirus. Arrow 2 shows that only the 5′ end is joined. Host sequence “ABC” is captured between the LTRs of a circular viral DNA. Both 5′ and 3′ ends (arrow 1 and arrow 2) are joined. Host sequence “ABC” is captured between the LTRs of a circular viral DNA, and the host chromosome is broken. (B) Models to explain the deletion of host sequences. In all cases (3′ only, 5′ only, and both 3′ and 5′ joined), a provirus is inserted with the loss of the host sequence “ABC.”

