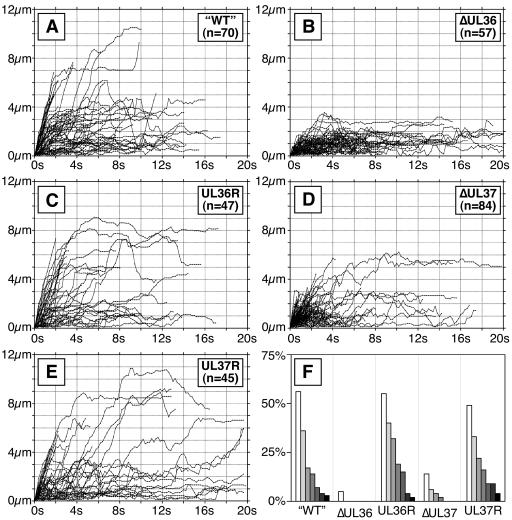
FIG. 5.
Transport of capsids in the cytoplasm. Individual moving fluorescent capsids were tracked in the cytoplasm of Vero cells at 18 hpi. Tracking was performed on time-lapse fluorescence recordings collected from a single focal plane at five frames/s. A profile of transport for each infection is shown by plots of the individual capsids tracked as distance from starting position in the first frame (y axis) versus time (x axis). Vero cells were infected with the following viruses: PRV-GS575 (A), PRV-GS678 (B), PRV-GS678R (C), PRV-GS993 (D), and PRV-GS993R (E). (F) Summary of data shown as percentage of tracked capsids that moved greater than 3, 4, 5, 6, 7, 8, and 9 μm from the origins for each infection (shown from left to right, respectively).

