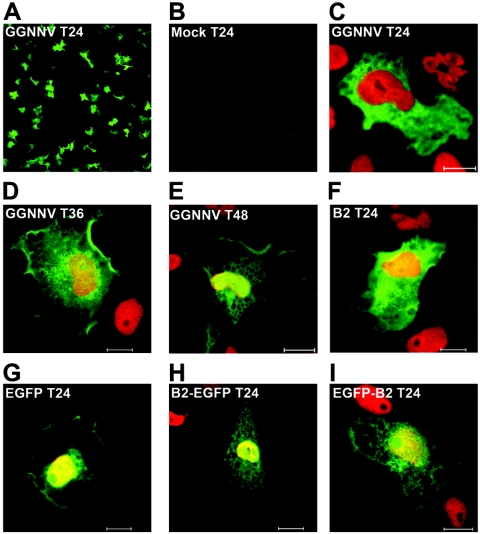
FIG. 7.
Visualization of GGNNV B2 in infected and transfected cells. SB cells either infected with GGNNV (A and C to E), mock infected (B), or transfected with pcDNA-B2 (F), pEGFP (G), pB2-EGFP (H), or pEGFP-B2 (I) were fixed at the indicated times postinfection or posttransfection using paraformaldehyde, subjected to IFA with anti-B2 polyclonal antibody where appropriate, and their nuclei were counterstained with DAPI (shown in red false coloring). Overlap between DAPI and EGFP is visible as yellow coloring. Fluorescence was visualized by using a Zeiss LSM510 META laser scanning microscope. Images are representative of the protein localization observed in the majority (>70% of at least 50 cells) of cells visualized. Bars in the lower right corners of the images represent 10 μm.

