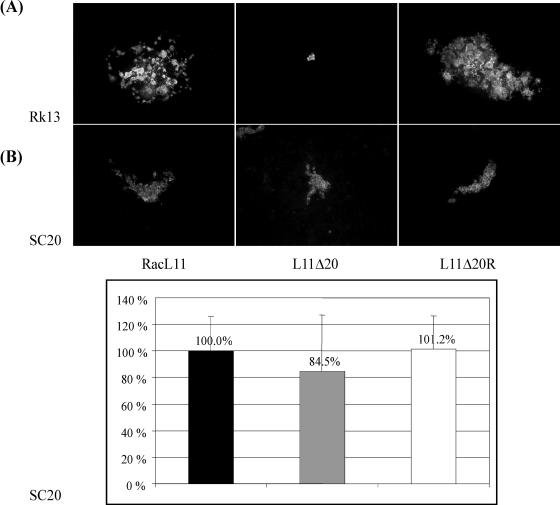
FIG. 3.
Plaque phenotype of RacL11, L11Δ20, or L11Δ20R. Rk13 (A) or SC20 cells (B) in six-well plates were infected with 50 PFU of the respective viruses per well. At day 3 p.i. plaques were immunofluorescently labeled (anti-gB MAb 4B6), and photographs were taken. Representative pictures of individual plaques are shown. Plaque areas were measured on SC20 cells with the help of the SPOTadvanced software. Mean plaque areas of RacL11 were set to 100%. Standard deviations are depicted above bars.

