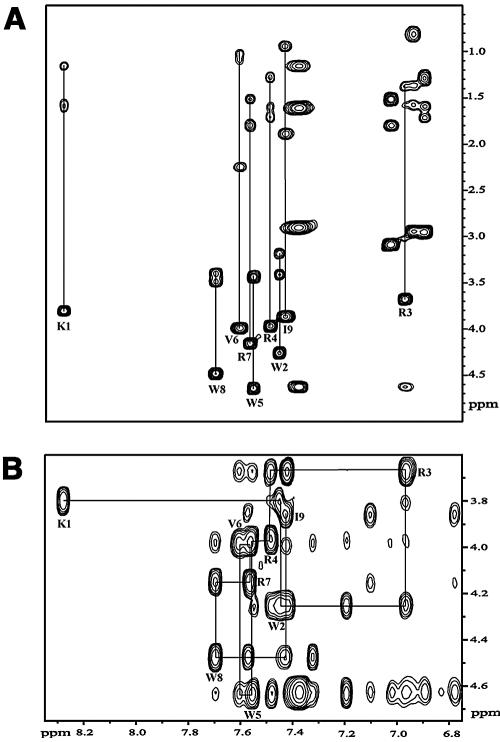
FIG. 4.
(A) A 600-MHz TOCSY spectrum, recorded at 70 ms of mixing time of Pac-525 (2 mM) in 200 mM SDS at 37°C, showing the NH (F2)-aliphatic (F1) region. (B) NH-CαH region of the 600-MHz NOESY spectrum recorded at 120 ms of mixing time for Pac-525 (2 mM) in 200 mM SDS at 37°C. Peaks are labeled at the positions of the NH-CαH cross-peaks.

