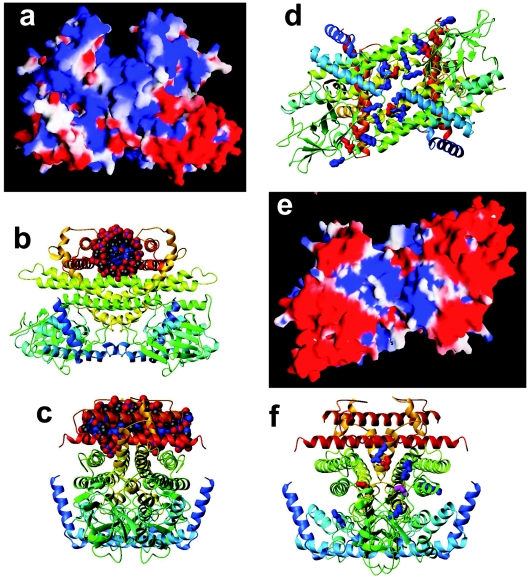
FIG. 5.
Homology model of AidB. (a) An electrostatic potential analysis of the homodimer, with the positive charge in blue and negative charge in red, depicting a positively charged canyon created by the C-terminal region of the protein. (b) The same view shown as a ribbon diagram, with the chain color varying from blue to red progressing from the N to C terminus, with a dodecamer of B-form DNA manually positioned in the positively charged canyon at the top. (c) The same molecule rotated by 90° around a vertical axis. (d) Ribbon diagram of the homodimer as viewed after rotating the structure from panels a and b by ∼90° around a horizontal axis. The canyon is now at the back of the molecule. A shallow groove is depicted with conserved positive residues shown in blue and conserved negative residues in red. (e) An electrostatic potential analysis of AidB in the same view. (f) Ribbon diagram of AidB as viewed in panel c with six conserved positively charged residues, three conserved negatively charged residues, and a conserved Cys, all located at the substrate-binding site of acyl-CoA dehydrogenases/oxidases, shown in blue, red, and yellow.

