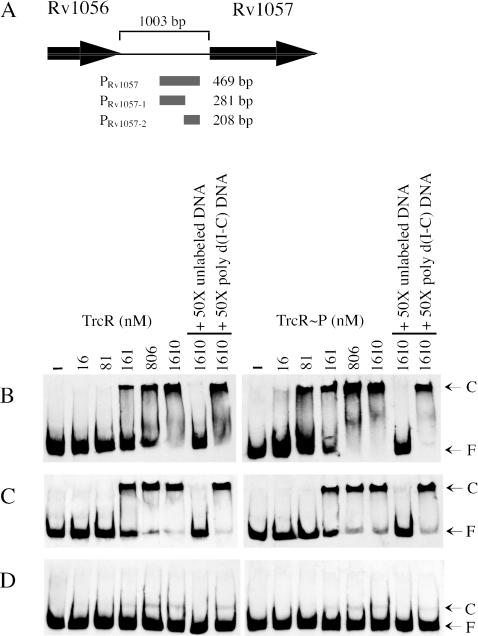
FIG. 1.
EMSAs demonstrating TrcR binding to the Rv1057 promoter. (A) Schematic representation of Rv1057 and the upstream adjacent region. The Rv1057 upstream intergenic regions used in the EMSAs are shown as shaded rectangles and are represented by a 469-bp DNA fragment, PRv1057 (panel B), a 281-bp DNA distal fragment, PRv1057-1 (panel C), and a 208-bp DNA proximal fragment, PRv1057-2 (panel D). The Rv1057 promoter fragments are shown unbound (DNA only), with increasing amounts of TrcR, and with increasing amounts of TrcR∼P. The concentration of TrcR (nM) is indicated above each lane. The positions of the free DNA (F) and complexed DNA (C) are shown with arrows.

