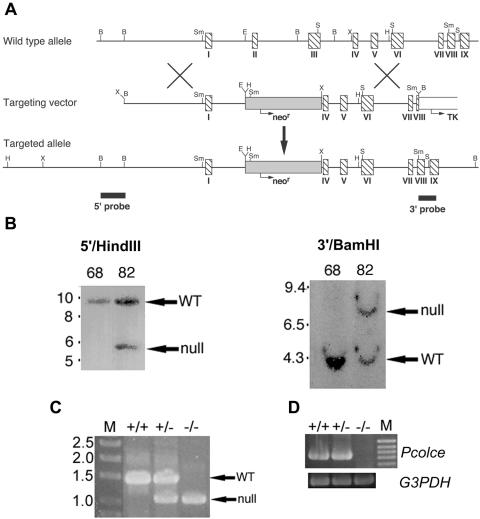
FIG. 1.
Targeted disruption of the Pcolce gene. (A) Structure of the targeting vector and Pcolce locus before and after homologous recombination. Horizontal arrows mark start sites and direction of transcription of neor (shaded box) and tk (open box) cassettes. Hatched boxes represent Pcolce exons. Black boxes represent a 554-bp 5′ external probe and a 414-bp 3′ external probe. B, BamHI; E, EcoRI; H, HindIII; S, SacI; Sm, SmaI; X, XbaI. (B) Southern blots of HindIII- or BamHI-restricted genomic DNA from a clone of untargeted ES cells (68) and from a clone of correctly targeted ES cells (82), hybridized to the 5′ or 3′ external probe, respectively. The 5′ probe detected bands of 9.5 and 5.5 kb from the wild-type (WT) and targeted alleles, respectively, while the 3′ probe detected bands of 4 and 8 kb from the wild-type and targeted alleles, respectively. Numbers at left of panels are molecular sizes in kilobases. (C) +/+, +/−, and −/− individuals were identified within the two mouse lines via PCR amplification using an internal neor primer (forward) and a reverse primer corresponding to Pcolce intron IV sequences, to generate a ∼1-kb band identifying the null allele, or using the same reverse primer but a forward primer corresponding to Pcolce intron II sequences, to generate a ∼1.35-kb band identifying the wild-type (WT) allele. M, DNA size markers marked with sizes in kilobases. (D) RT-PCR analysis of poly(A)+ RNA prepared from MEFs detected a 734-bp amplimer for +/+ and +/− MEFs but no bands for −/− MEFs. M, 100-bp marker ladder with the 1-kb marker corresponding to the topmost band visible in the figure. G3PDH, glyceraldehyde-3-phosphate dehydrogenase.

