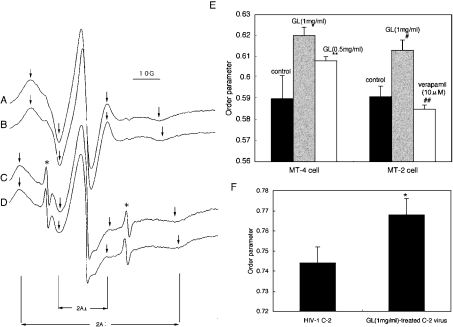
Figure 2. Effects of GL on the fluidity of the plasma membrane and viral envelope.
ESR spectra of plasma membrane from intact MT-2 (A) and 1 mg/ml GL-treated MT-2 (B) and viral envelope from intact HIV-1 C-2 (C) and 1 mg/ml GL-treated HIV-1 C-2 (D) are shown. The outer and inner hyperfine splittings, 2A∥ and 2A⊥, were measured as shown by arrows. Asterisks show spectra of free 5-DSA remaining in each sample. Order parameters (S values) of (A), (B), (C) and (D) were 0.581, 0.615, 0.750 and 0.778 respectively. The scale of the horizontal axis (magnetic field) is shown as 10 G, equivalent to 1 mT. (E) MT-4 cells were treated with 1 and 0.5 mg/ml GL and membrane fluidity was assessed (control, n=6; 1 and 0.5 mg/ml GL, n=3 each). *P<0.01 compared with control and P<0.02 compared with 0.5 mg/ml GL. **P<0.05 compared with control. MT-2 cells were treated with 1 mg/ml GL and 10 μM verapamil (control, n=6; 1 mg/ml GL, n=3; 10 μM verapamil, n=3). #P<0.001 compared with controls and ##P<0.1 compared with controls. Bars show means±S.D. of repeated experiments. (F) HIV-1 C-2 were treated with 1 mg/ml GL and envelope fluidity was assessed. Values are means±S.D. for three independent experiments. * P<0.05 compared with HIV-1 C-2.

