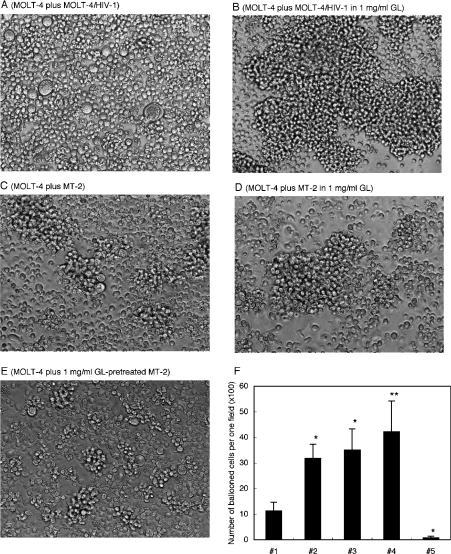
Figure 5. Effects of GL on HIV-1- and HTLV-I-induced cell fusion.
MOLT-4 target cells were co-cultured with effector MOLT-4/HIV-1C-2 cells in the absence (A) or presence (B) of 1 mg/ml GL. MOLT-4 cells were also co-cultured with HTLV-I-transformed MT-2 cells in the absence (C) or presence (D) of 1 mg/ml GL, and were co-cultured with GL-pretreated MT-2 cells (E). After 24 h co-cultivation, photomicrographs were taken (magnification, ×100). (F) Results are shown as the number of ballooned cells per one field (magnification, ×100) for MT-2 cells co-cultured with MOLT-4 cells (#1), MT-2 cells with GL-pretreated MOLT-4 cells (#2), GL-pretreated MT-2 cells with MOLT-4 cells (#3), GL-pretreated MT-2 cells with GL-pretreated MOLT-4 cells (#4) and MT-2 cells co-cultured with MOLT-4 cells in the presence of 1 mg/ml GL (#5). Bars show means±S.D. of three independent experiments. *P<0.02 compared with MT-2 cells co-cultured with MOLT-4 cells (#1), **P<0.05 compared with MT-2 cells co-cultured with MOLT-4 cells (#1).

