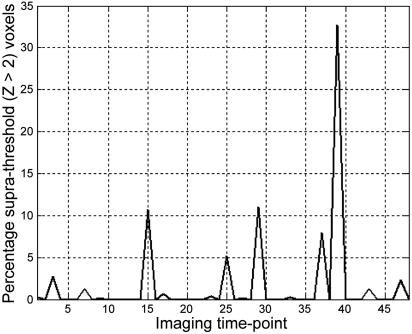
Fig. 2.
Fluctuation in baseline activity during silence in functionally defined speech-sensitive auditory cortex. Data are presented from a single subject. The ordinate shows the percentage of functionally defined left-hemisphere voxels that are >2 SD above their own mean value during silence imaging time points (abscissa).

