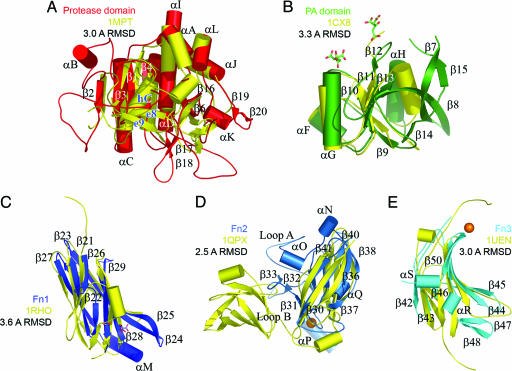
Fig. 2.
Ribbon drawings of individual SCPBw domains (colored as in Fig. 1) superimposed with nearest structural homolog (yellow, Protein Data Bank ID code and RMSD between Cαs are indicated). Secondary structural elements are labeled as in Fig. 3. Calcium binding sites are shown as spheres. Bound citrates and acetate are shown as sticks. (A) Protease domain with Bacillus M-protease. (B) PA domain with the apical domain from TfR (26). (C) Fn1 with human Rho guanine nucleotide dissociation inhibitor (37). (D) Fn2 with PapD from E. coli (38). (E) Fn3 with third Fn from human Kiaa0343 protein.

