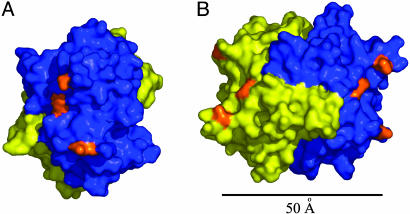
Fig. 3.
The glycosylation sites on CREG. (A) A view of the three potential N-glycosylation sites on one face of the CREG dimer. One molecule is colored in blue, and the second molecule is colored in yellow. The three potentially glycosylated Asn residues (160, 193, and 216) are colored in orange. (B) A relative disposition of the two N-glycosylation patches on opposite faces of the CREG dimer. The molecule in A was rotated ≈90° around the y axis. The distance between the nearest asparagine residues is ≈50 Å. B was rendered with pymol and is colored as in A.

