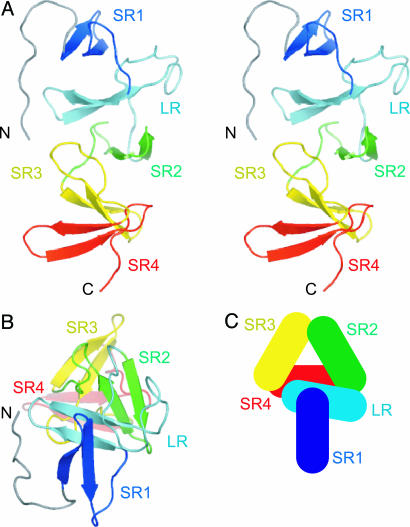
Fig. 1.
Overall structure of TcdA-f1. (A) Stereoscopic view of a ribbon representation of the structure of TcdA-f1, with each β-hairpin motif colored separately (N terminus to C terminus): blue, cyan, green, yellow, and red. (B) View of TcdA-f1 ribbon representation from the N-terminal end and down the axis of the β-solenoid. (C) Schematic representation of β-hairpins (rectangles) in the β-solenoid fold. All figures were prepared by using pymol (52).

