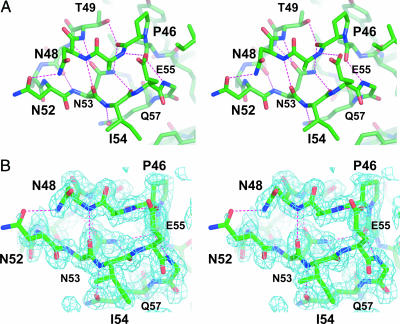
Fig. 3.
LR loop structure. (A) Stereoscopic view of the highly conserved loop region found within the LRs from TcdA (residues 45–64 in TcdA-f1). Hydrogen bonds are drawn as dashed lines. (B) Stereoscopic view of the experimentally phased electron density map (contoured at 1 σ) in the region of the highly conserved loop. The map is calculated by using phases following MAD analysis with solve and density modification with resolve.

