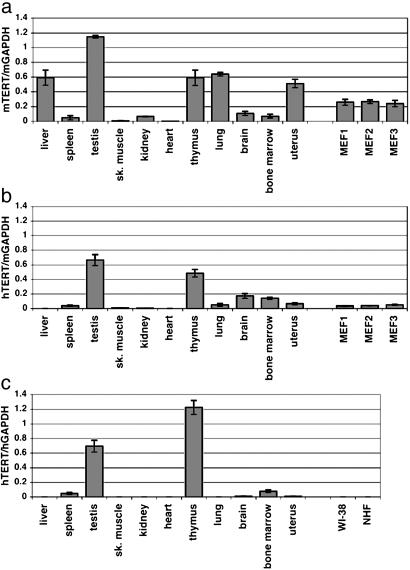
Fig. 1.
Real-time quantitative RT-PCR analysis of mTERT and hTERT expression. RNA samples from various tissues in humans and transgenic mice and from fibroblasts (MEF1–3 and two human fibroblast strains WI-38 and NHF) were examined for mTERT and hTERT mRNA levels. (a) mTERT expression normalized with mGAPDH in mTERT+/–hTERT+ transgenic mice. (b) hTERT expression normalized with mGAPDH in mTERT+/–hTERT+ transgenic mice. In a and b, tissue RNA samples (except for testis and uterus) were pooled from one male and one female 8-week-old mouse (line BAC-C10). Testis or uterus sample was from one 8-week-old male or female mouse (line BAC-C10), respectively. Tissue RNA samples similarly pooled from the other line of mTERT+/–hTERT+ mice (BAC-C2) were also examined and confirmed to give similar levels of mTERT and hTERT expression to the data shown here. MEF1, MEF2, and MEF3 are three independent preparations of fibroblasts from BAC-C10 embryos. (c) hTERT expression normalized with hGAPDH in humans. See Materials and Methods for sources of human tissue RNA samples. For human liver, another RNA sample pooled from 23 individuals was also confirmed negative for hTERT expression (data not shown).

