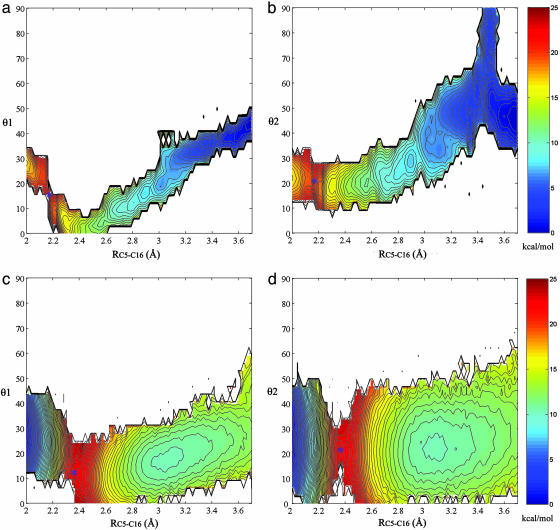
Fig. 3.
NAC conformation characterization. The RC5-C16 ranges from 2.0 to 3.7 Å, θ1 and θ2 range from 0° to 90°, and the increment of the contour line is 0.5 kcal/mol. 1D PMFs along the reaction coordinate RC5-C16 are projected to the θ1 and θ2, respectively. The TS is labeled by blue asterisks. (a and b) PMF of the reaction in water projected to θ1 (a) and θ2 (b). (c and d) PMF of the reaction in TtCM projected to θ1 (c) and θ2 (d).

