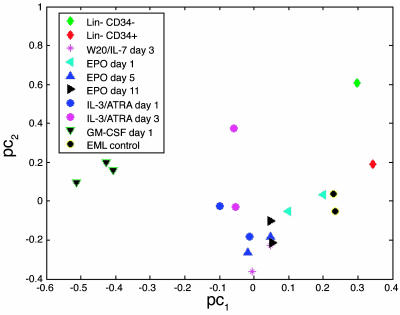
Fig. 2.
Principal component analysis of transcription factor expression by Lin–CD34+, Lin–CD34–, parental EML, and different differentiated EML cells. Principal component analysis allows us to present the distribution of the samples in the multidimensional transcription factor expression space in a 2D graph. A preliminary step of the analysis is a binormalization procedure that simultaneously centers the transcription factor profile of each sample and expression intensities across all samples of each transcription factor around zero. The principal components are linear combinations of the normalized transcription factor expression profiles. The first two leading principal components capture most of the variation of the data. Therefore, the data can be displayed (with a minor loss of information) in a 2D graph by projection of the 19 samples onto a subspace spanned by the two leading principal components. The axes legends pc1 and pc2 stand for the first two principal components. The distances between the samples in this 2D space is an approximation of the dissimilarities between their corresponding transcription factor expression profiles. The cell types are represented by the symbols indicated in Inset.

