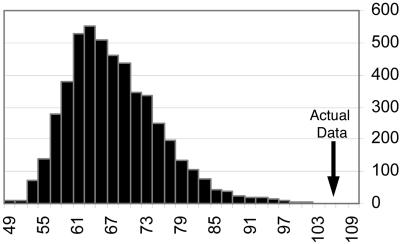
Fig. 3.
Distribution of relations scores for surrogate spike trains and the actual data. Five thousand surrogate spike trains were independently generated by teetering spike times within 10 ms. For each of these, a relations score was extracted. The distribution of these relations-score values was estimated by a histogram. The actual data had a value of 106.37 (arrow). None of the 5,000 surrogate trains had a value above it. Hence, the p value for the actual data were estimated as <1/5,000.

