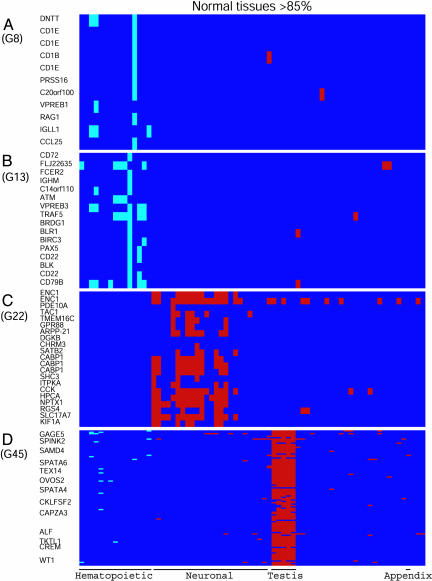
Fig. 3.
Highly expressed genes in some H and NH clusters in normal tissues. (A and B) H clusters. (C and D) NH clusters. Genes that are highly expressed in normal hematopoietic tissue samples or in any of the other normal tissues are marked as pale blue or red boxes, respectively. As in Fig. 1, not all the gene names are marked on the left side of D. The order of the normal tissue samples is as in Fig. 1.

