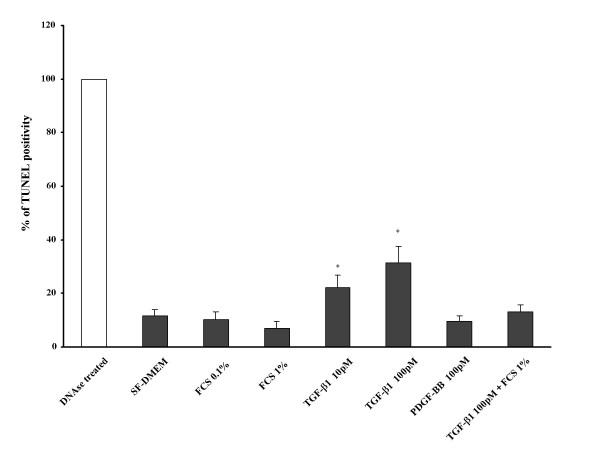
Figure 3.
TUNEL positivity in HFL-1 with FCS, TGF-β1 and PDGF-BB. After staining, TUNEL positive cells as a % of total cells were counted under the microscope in 5 high-power fields. Vertical axis: TUNEL positivity expressed as % of positive control (DNAse treated). Horizontal axis: condition. TGF-β1 increased TUNEL positivity. In contrast, FCS or PDGF-BB did not affect TUNEL positivity. *p < 0.05, as compared with control. Data are shown as means ± SEM. Data presented are from one representative experiment of three experiments performed on separate occasions.

