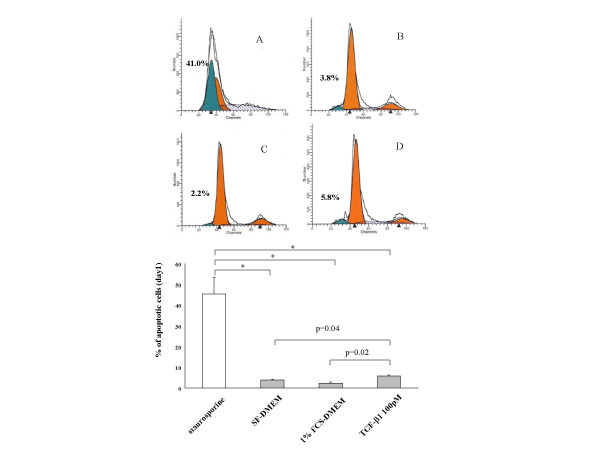
Figure 4.
Representative profile of DNA content in fibroblasts. Collagen gels with fibroblasts were floated in (A) Staurosporine 1 μM for 6 hours, (B) SF-DMEM, (C) 1% FCS-DMEM and (D) TGF-β1 100 pM for 24 hours. Cells were then isolated and analyzed by flow cytometry. Vertical axis: cell number; horizontal axis: DNA content. The percentage of cells with hypodiploid DNA taken as an index of apoptosis is shown in each panel. Figure presented is from one representative experiment of three experiments performed on separate occasions. *p < 0.01. Data are shown as means ± SEM. Comparison of the means were done by one-way ANOVA.

