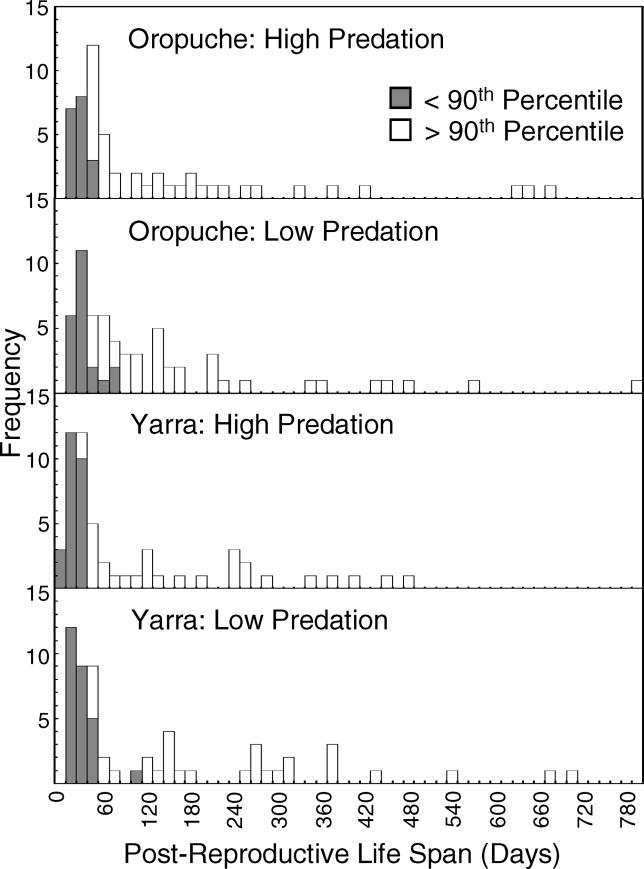
Figure 2. The Distribution of Post-Reproductive Lifespans.
Each drainage × predation combination is displayed separately. Filled bars represent females who died within the 90th percentile for their interbrood interval, or the interval during which they are expected to produce another brood of offspring. Open bars represent females that lived beyond their 90th percentile and hence are interpreted as having a significant post-reproductive lifespan.

