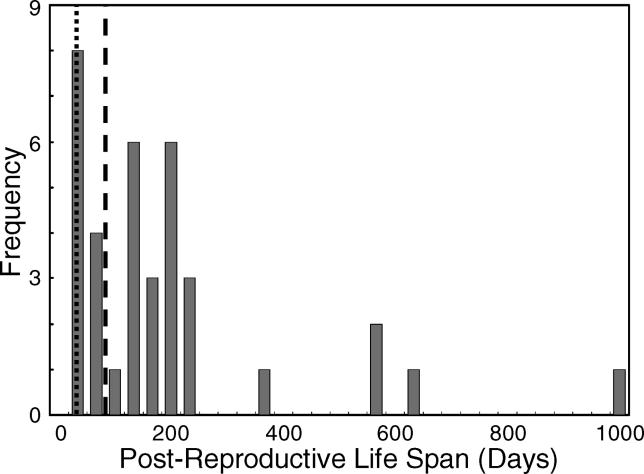
Figure 3. The Distribution of Values for Post-Reproductive Lifespan in Comfort (1961).
Comfort [7] reported the age at last reproduction and age at death in one of his studies of senescence in domestic guppies. We report here a summary distribution of their post-reproductive lifespan. For purposes of comparison, the dotted vertical line represents the mean 90th percentile for the number of days between successive litters of young in our data set for Trinidadian guppies. The dashed line represents the 95th percentile for this mean value. This figure shows that the shape of the distribution of post-reproductive lifespans for Comfort's guppies was similar to that observed in our study. It also shows that the average duration of the post-reproductive lifespan was longer, which correlates positively with their longer total lifespans.

