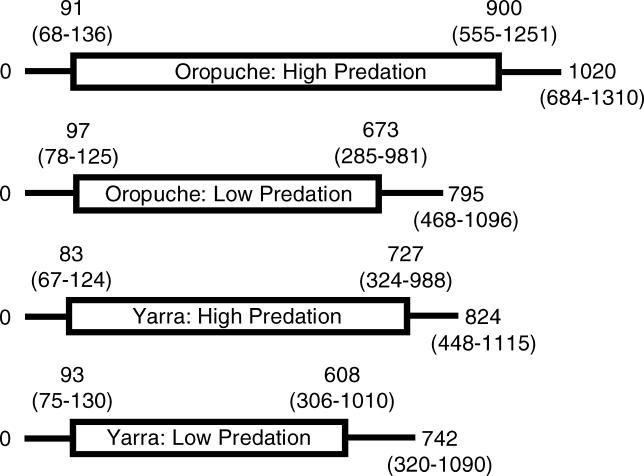
Figure 4. Summary of the Total Lifespan of Guppies, Reported Separately for Each Drainage × Predation Combination.
The timeline reports the mean age at first reproduction, mean age at last reproduction (mean age at first reproduction plus mean reproductive lifespan), and total lifespan (mean age at first reproduction plus mean reproductive lifespan plus median post-reproductive lifespan). The range of values is reported in parentheses next to each mean and median value. This summary illustrates the overall differences in total lifespan and the fact that these differences are attributable to the duration of the reproductive lifespan alone. Note that we averaged the results for high- and low-food availability to simplify the presentation.

