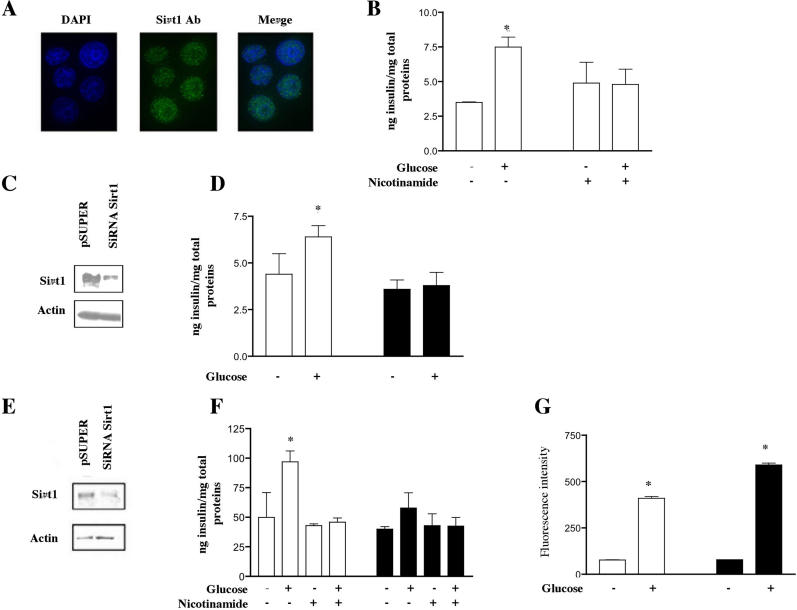
Figure 3. Sirt1 Is a Positive Regulator of Insulin Secretion in INS-1 and MIN6 Cells.
(A) Immunofluorescence in INS-1 cells using Sirt1 antibody (green) and DAPI staining (blue). Nuclear localization of Sirt1 is evident.
(B) Induction of insulin secretion in INS-1 cells with 16.7 mM glucose (+) compared with 4 mM glucose control (−). The left side shows no nicotinamide and the right side shows treatment with 10 mM nicotinamide for 48 h prior to induction (n = 3 experiments done in triplicate, *p < 0.05 in the no nicotinamide experiment, ANOVA).
(C) Western blot of Sirt1 in INS-1 cells with knockdown levels of the protein (SiRNA Sirt1) compared with control cells (pSUPER).
(D) INS-1 cells infected with the pSUPERretro SiRNA-GFP control (open bars) or pSUPER retro SiRNA-Sirt1 knockdown cells (black bars) were induced for insulin secretion as in (B) (n = 3 experiments done in triplicate, *p < 0.008 in the control experiment, ANOVA).
(E) Western blot of Sirt1 in MIN6 cells with knockdown levels of the protein (SiRNA Sirt1) compared with control cells (pSUPER).
(F) Glucose induction (20 mM versus 4 mM) of insulin secretion in MIN6 cells with the pSUPER control vector (open bars) or the SiRNA Sirt1 vector (black bars) in the absence or presence of nicotinamide (n = 3 experiments done in triplicate*p < 0.05 in the control without nicotinamide, ANOVA).
(G) Glucose uptake in INS-1 cells stably transfected with control or SiRNA Sirt1 vectors. 2-NBDG fluorescence was determined by flow cytometry 10 min after addition and expressed as arbitrary units (n = 2, *p < 0.0005 compared with no glucose).

