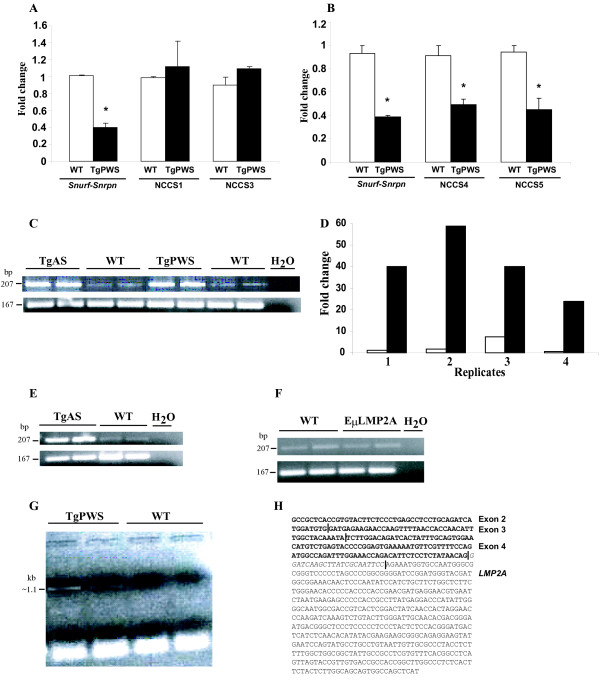
Figure 4.
Mapping of centromeric and telomeric TgPWS/TgAS deletion breakpoints and tissue specific up-regulation of Chrna7. (A) Q-PCR for the Snurf-Snrpn promoter, NCCS1 and NCCS3 relative to Gapdh intron 1. The amount of Snurf-Snrpn DNA was 1.01 ± 0.01 for the WT compared with 0.40 ± 0.05 for the TgPWS samples, P = 0.006. For NCCS1, DNA fold was 0.98 ± 0.02 in WT vs. 1.12 ± 0.30 in TgPWS, P = 0.68. For NCCS3, DNA fold was 0.90 ± 0.09 in WT compared with 1.09 ± 0.03 in TgPWS mice, P = 0.20. (B) Q-PCR for NCCS4 and NCCS5 relative to Gapdh intron 1. Snurf-Snrpn DNA-fold was 0.40 ± 0.07 in TgPWS vs. 0.90 ± 0.1 in WT mice, P = 0.02. The amount of DNA for NCCS4 was 0.50 ± 0.05 in TgPWS and 0.90 ± 0.1 in WT mice, P = 0.05. For NCCS5, DNA-fold was 0.45 ± 0.1 in TgPWS and 0.94 ± 0.06 in WT mice, P = 0.05. (C) Chrna7 expression (207-bp) is dramatically upregulated in liver of TgPWS and TgAS at P1 compared with WT mice by RT-PCR. RNApolII expression (167-bp) was used as a control in (C), (E) and (F). (D) Relative quantification by QRT-PCR of Chrna7 liver mRNA levels shows a ≥15-fold increased expression in TgPWS (black bars) vs. WT (open bars) mice. Individual values for Chrna7 mRNA expression of 4 TgPWS and 4 WT mice at P1 are shown. The average mRNA expression was 40.76 ± 14.30 for TgPWS and 2.70 ± 3.21 for WT, P = 0.002. (E) Up-regulation of Chrna7 expression in TgAS spleen compared with WT at P1 by RT-PCR. (F) Chrna7 is normally expressed in P1 liver from EμLMP2A transgenic mice compared with WT liver. (G) A Chrna7-LMP2A fusion transcript is identified by RT-PCR in TgPWS brain (lanes 1,2) but not in WT (lanes 3,4). (H) DNA sequence of the Chrna7-LMP2A fusion cDNA. Vertical lines mark the limit between exons 2, 3 and 4 of Chrna7 (bold font) and the 5' end of LMP2A sequence, while the 22-nt in italics is a transgene-specific sequence at the 5' end of the LMP2A exon.

