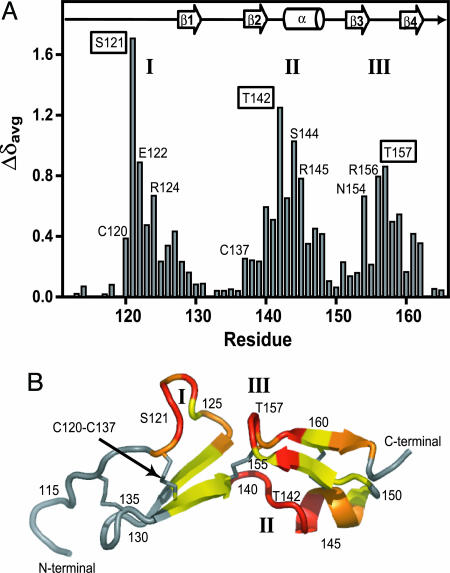
Fig. 4.
HBD chemical shift changes upon aptamer binding. (A) The weighted average 1H/15N backbone amide chemical shift changes (Δδavg) of the HBD upon binding to the aptamer. Three regions with large chemical shift changes are labeled as I, II, and III. The residues with the largest chemical shift changes in each region are boxed (S121, T142, and T157). The positions of the secondary structure elements are shown for the free HBD (6). (B) Secondary structural model for the previously determined NMR structure of the free HBD (6). Colors used to illustrate 1H/15N backbone chemical shift changes (Δδavg) upon aptamer binding are: red, >0.5 ppm; magenta, 0.3–0.5 ppm; yellow, 0.1–0.3 ppm; gray, <0.1 ppm. The three regions with large chemical shift changes are labeled I, II, and III.

