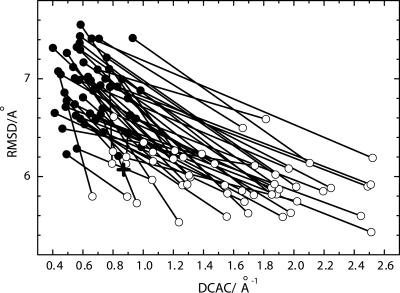
Fig. 1.
Changes in DCAC and rms distance (RMSD) through 50 independent runs of the functional selection. For each selection run, a filled circle for the initial random sequence and an open circle for the resulted sequence with the smallest RMSD in 200 generations are connected by a line. RMSD is averaged over all of the (50 × 49)/2 pairs of final structures of 50 folding trajectories for the sequence at each generation. The cross shows the averaged RMSD and DCAC of the model functional protein (PDB ID code 1enh) calculated from 50 independent folding simulations using the same model of folding.

