Fig. 3.
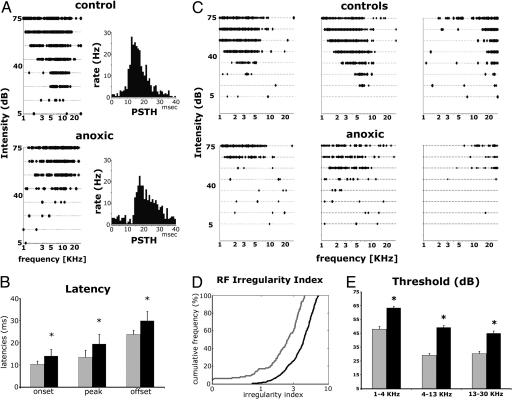
Tone pip-evoked unit responses in the auditory cortex. (A) Left show representative examples of TCs obtained from one control (Upper) and one PA rat (Lower). Right show their PSTHs obtained in response to test tone pips. A1 neurons were identified by short-latency responses (6-7 to 20 ms) and tonotopy. (B) Bar graph showing average time (ms) to PSTH onset, peak, and offset obtained from four control (gray) and eight PA rats (black). (C) Representative example of TCs obtained from adult control (a-c) and PA (d-f) rats. A1 neurons in control rats responded continuously and reliably to test tones with a clearly delineable area or tuning curve. By contrast, discontinuous responses (lack of reliable responses to some of the test tones) and recurring blank domains within the TC increased (d) or decreased (e) sensitivity, and broad TCs (e and f) were recorded in PA rats. (D) A1 RFs were significantly degraded in PA rats as measured with the RF irregularity index. In control rats, the average RF irregularity index was 2.41 ± 0.13 and 4.20 ± 0.08 (mean ± SEM) for PA rats. An irregularity index >4, commonly observed in PA rats, was never seen in controls. (E) Response thresholds for three frequency ranges obtained from four control (gray) and eight PA rats (black). Asterisks mark significant difference bands.

